What are Profitable Farms Doing? Observations from the Canadian Cow-Calf Cost of Production Network
What do profitable farms do? This is one of the questions the Canadian Cow-Calf Cost of Production Network (COP Network) tries to answer by benchmarking cow-calf production systems across Canada.
Sign up to become part of the Canadian Cow-Calf Cost of Production Network by November 30, 2022. A $500 honorarium is provided to each participating farm.
As of 2022, the COP Network is comprised of 46 benchmark cow-calf farms and three dairy-beef farms, with data collected from 186 participants across Canada. Farms within the COP Network represent a variety of Canadian production systems, including variation in animal performance, economies of scale, labour productivity, feeding and farm financials.
Based on data from these benchmark farms for the 2021 production year, it is observed that the higher profit farms within the Network tend to have more cows, smaller cows and lower costs per cow. The following analysis looks at the cow-calf enterprise alone and results do vary at the whole-farm level when other enterprises are considered.
How are the benchmark farms created? A New Approach to Cost of Production Benchmarking
More Cows
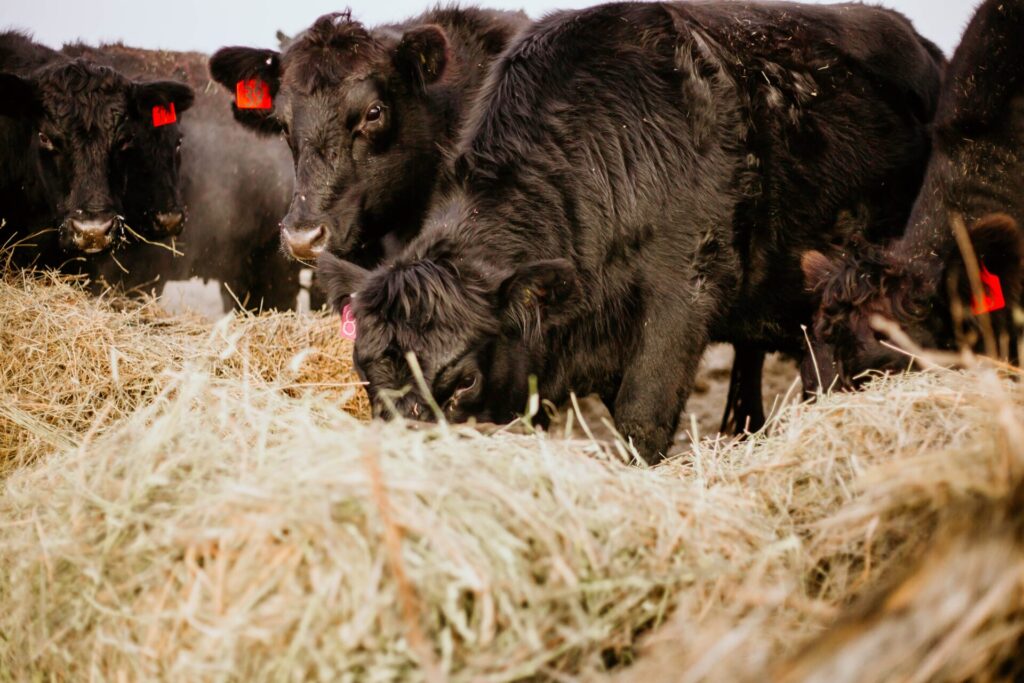
The COP Network covers a range of herd sizes, within provinces and nationally. Herd sizes range from 35 head of beef cows to 950 head. Among the 46 benchmark cow-calf farms, 19 farms had fewer than 100 cows, 10 farms were in the 100-200 cow range, nine farms had between 201 and 300 cows and eight farms had more than 300 cows.
The 2021 results indicated that farms with a larger herd were more likely to cover their cash and depreciation costs.
For the two groups that had fewer than 100 or between 100-200 cows, only 47% and 50%, respectively, were covering their cash and depreciation costs in 2021. Once the herd size gets over 200 head, the percentage of farms covering these costs increased to 75% to 89%.
The major driving factor behind this pattern was the economies of scale, as larger herd operations were able to spread overhead costs over more cows.
Cash costs included purchased feed, fertilizer, seed, fuel, maintenance, land rent, interest on liabilities, wages paid, veterinary costs plus medicine, insurance, accounting, etc.
Depreciation is the value of an asset that decreases over time due to use, wear and tear or becoming outdated.
Percentage of Benchmark Farms that Covered Cash and Depreciation Costs in 2021, by Herd Size
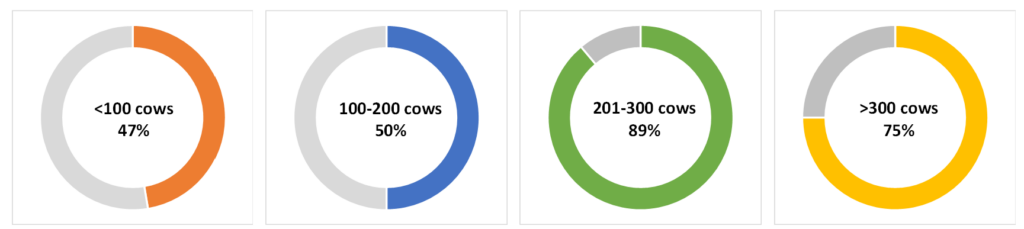
The lower percentage covering cash costs and depreciation in the >300 group at 75%, compared to the 201-300 head group at 89% was due to some of the farms being hit harder by drought conditions in 2021 and dealing with sharper increases in feed costs (i.e., with a lack of surplus feedstocks and/or other enterprises that used feed).
Smaller cows
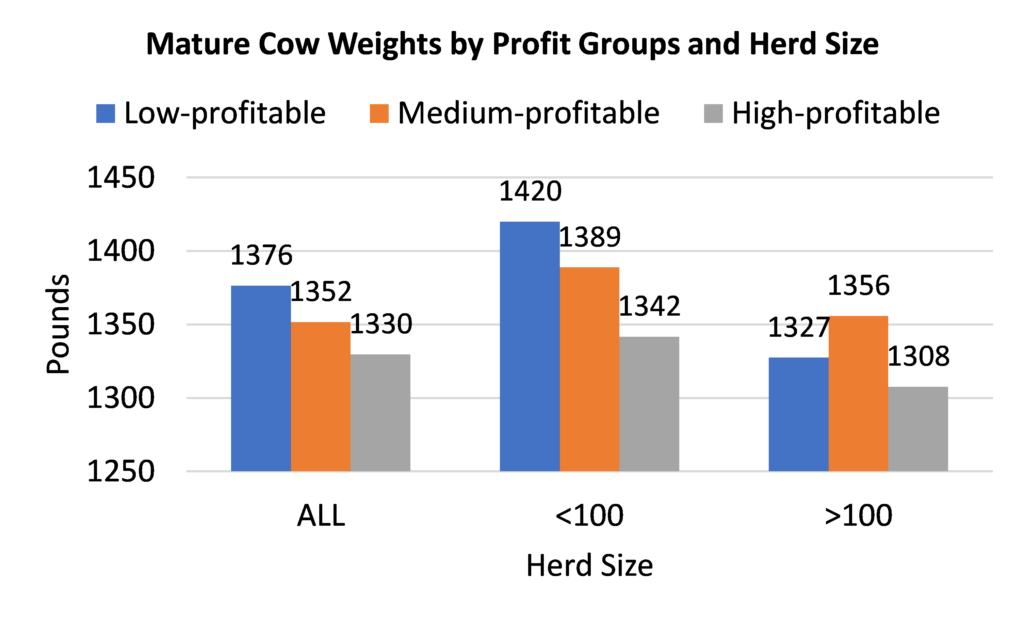
Mature cow weights on the benchmark farms ranged from 1,200 lb to 1,540 lb with an average of 1,355 lb. This is similar to the average mature cow weight reported in the 2017 Western Canadian Cow-Calf Survey (1,374 lb).
When all the benchmark farms were divided into three groups (namely low-, medium-, or high-profitable group) based on net income, the high-profitable group in 2021 tended to have lighter mature cow weights.
Looking at all benchmark farms, mature cow weights in the high-profitable group were an average of 47 lb lighter than the low-profitable group. Within the benchmark farms with less than 100 cows, the difference was even greater. Average mature cow weights in the high-profitable group were about 78 lb lighter than the low-profitable group. For the farms with over 100 cows, the medium-profitable group had the heaviest average mature cow weights, while the high-profitable group was about 20 lb lighter than the low-profitable group.
Net Income = Total Receipts – Total Expenses – Depreciation +/- Inventory Change + Interest on Savings +/- Capital Gains/Losses
One of the concerns with smaller cows is fewer pounds of calf weaned and thus fewer pounds sold to make revenue on. As mature cow weights declined from the low- to high-profitable group, weaning weights also declined by 19 lb between the two groups. However, weaning weight as a percentage of mature cow weights were steady across the three groups at around 41%.
The lower costs of maintaining smaller cows appeared to offset the lower revenue on lighter calves and had positive impacts on profitability. This may be particularly true for the drought-affected farms in 2021 given the skyrocketed feed prices and relatively stable cattle prices.
Lower Costs
Profitability is measured with revenue and costs. While the high-profitable group had higher returns and lower costs compared to the low-profitable group, total returns per cow were only up 11% from the low to high profit group, while the decline in total costs per cow was more significant at 32%. This indicated that lower cost was the more significant contributing factor to the difference in profitability between the low- and high-profitable group.
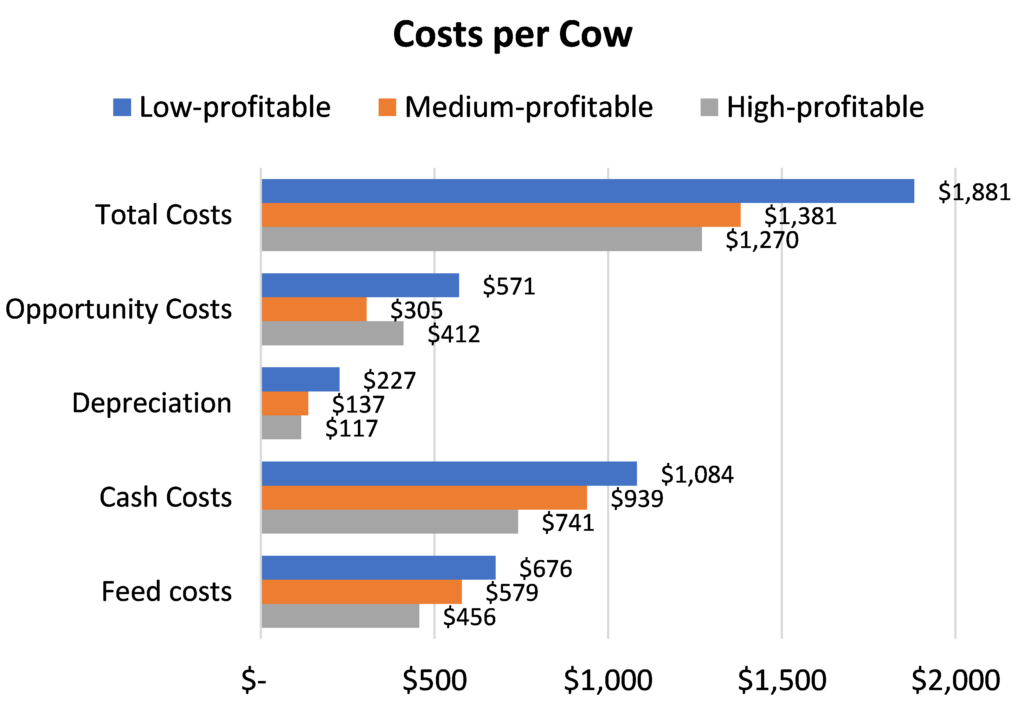
Looking at cost structure, average depreciation and cash costs dropped 48% and 30%, respectively from the low- to high-profitable group. Opportunity costs were an exception with a 35% increase from the medium to high profitable group. This was driven by higher (+14%) unpaid labour hours per cow, higher (+13%) wages for the unpaid labour, as well as higher (+16%) estimated rental price for owned land.
Feed cost, a significant component of total cost, also dropped more than 30% from the low to high profitable group. Lower feed costs were not necessarily driven by fewer days on feed. On average the high profitable group had more days on full winter feed and total feeding days compared to the low profitable group.
A driver behind the lower feed costs was the cost of feed production. As most of the COP Network farms used homegrown feed, with only a few relying on purchased feed, lower average feed costs were mostly associated with the costs of producing feed on the operation. On average, the combined costs of purchased feed, fertilizer, seed and other variable inputs dropped more than 30% from the low to high profitable group. Land costs were relatively stable across the three groups while labour and capital costs declined by around 40% from the low to high profitable group.
Bottom Line
As the COP Network shed light on some of the commonalities of the profitable farms, the results showed that profitability did not relate to a specific production system, farm structure or region. Each operation had its own unique approach to achieve financial success.
The COP Network offers a unique opportunity for continuous learning. Participating producers can benefit throughout the process – from the collection and understanding of your own data, to taking part in virtual focus groups and learning from other producers, to exploring potential practice changes in the future.
Continuous learning is the number one farm management practice that contributes to financial success.
The Dollar and Sense Report 2015
Sign up by November 30, 2022, and take your first step toward further learning. A $500 honorarium is offered for each participating farm.
LEARN MORE
- Canadian Cow-Calf Cost of Production Network
- Cost, Profits and What If? The Canadian Cow-Calf Cost of Production Network (BCRC webinar)
- Every Farm Has Different Goalposts – Setting Goals and Defining Success (BCRC post)
- A New Approach to Cost of Production Benchmarking (BCRC post)
Sharing or reprinting BCRC posts is welcome and encouraged. Please credit the Beef Cattle Research Council, provide the website address, www.BeefResearch.ca, and let us know you have chosen to share the article by emailing us at [email protected].
The BCRC is funded by a portion of the Canadian Beef Cattle Check-Off.
Your questions, comments and suggestions are welcome. Contact us directly or spark a public discussion by posting your thoughts below.