Cost of Production First Steps: Production Indicators
This is a guest post written by Kathy Larson, MSc, PAg, Beef Economist with the Western Beef Development Centre.
Last month’s announcement of the Western Livestock Price Insurance Program (WLPIP) is welcome news. This spring, cow-calf producers will have the opportunity to lock in prices for their 2014 calves. When deciding which level of coverage to take, it would be useful to know what price a producer needs to break-even. The break-even price on weaned calves is also known as the cow-calf unit cost of production.
The Western Beef Development Centre (WBDC) has been assisting Saskatchewan cow-calf ranchers with their cost of production since the late 1990s. Often times cost of production benchmarks are reported as dollars per cow, but a more useful way to report cost of production is in dollars per lb of calf weaned. Weaned calves are the primary revenue source for a cow-calf rancher, so dividing costs over the primary unit sold is a very important calculation.
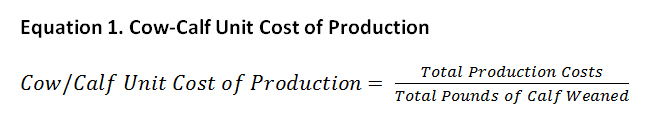
Dividing total production costs for the cow herd by the total pounds of calf weaned yields the unit cost of production or break-even price (see Equation 1 below). As the equation illustrates, a rancher’s break-even price can be lowered by either: a) reducing production costs, or; b) increasing pounds of calf weaned. Knowing production costs in $/lb of weaned calf allows a producer to do direct comparisons with posted market prices.
I deal with ranchers all the time that are interested in calculating their cost of production, but they become discouraged when they see the amount of production and financial information required for the analysis. In order to not be overwhelmed, it is ideal to track production information throughout the year. As the saying goes, “you cannot manage what you do not measure”.
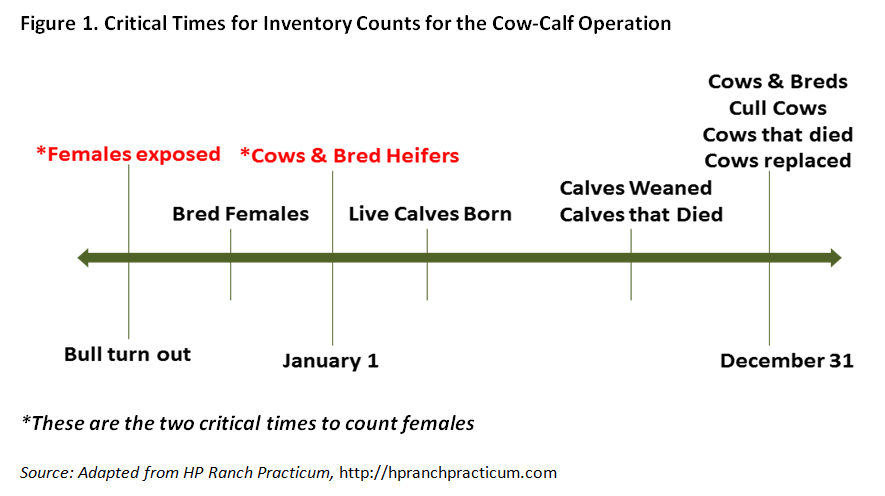
One of the biggest areas of consternation is inventory numbers; how many females were exposed to a bull, how many calves were born, how many calves were weaned, how many cows were sold, how many cows died, how many bred heifers were purchased, etc. Figure 1 shows a timeline with the important times throughout the production year to count breeding stock (cows, bred heifers, bulls) and calves.
Tracking production data for cost of production extends beyond the calendar year and should start with bull turn out, making note of how many cows and heifers were exposed for breeding as well as the bull turn out and pull dates. The other critical time to count cows and bulls is January 1st. Additionally, knowing how many females were safe in calf at pregnancy check, how many breeding stock (cows, bred heifers and bulls) died throughout the year, or were sold or replaced is important. Knowing these numbers will make it easy to reconcile with December 31st inventory counts. The calf crop details to track are live calves, calf deaths and number of calves weaned.
If you are able to count breeding females, bulls and calves at the points indicated in Figure 1, you are doing yourself a huge service and you are well on your way to having the production details necessary to calculate your cow-calf cost of production.
These inventory numbers can also be used to measure the productivity of your herd. After all, being a low-cost producer is nothing if you do not have strong productivity. Open cows, lengthy calving seasons and low wean percentages translate into reduced revenues and limited profit potential. For example, two ranches with the same production costs on a per cow basis can have different unit costs of production (i.e., break-even prices) due to lower weaning weights and wean percentages.
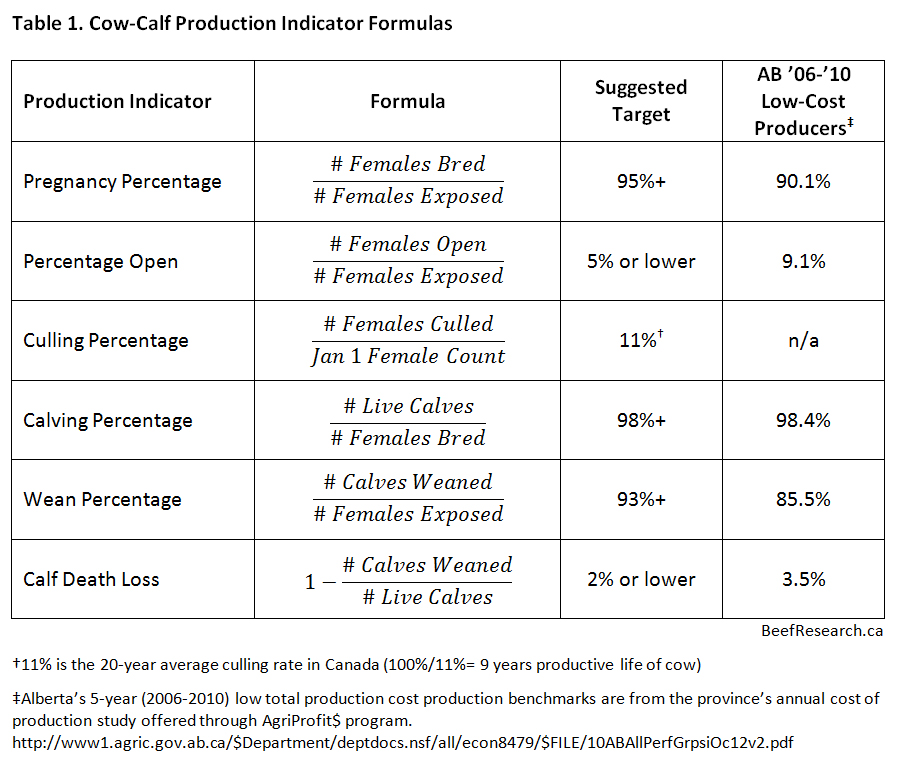
There are a number of useful production indicators that can be calculated from the inventory numbers collected as per Figure 1. Table 1 shows formulas for various production indicators and gives suggested targets for these indicators, however, you are better off to compare yourself across multiple years from your own ranch data rather than comparing with these suggested targets or others you can find online (such as North Dakota Farm Business Management Production Indicators, 2012 Benchmarks).
To put this into perspective, if a 150-cow herd increased its conception rate by 2% (all else being equal), the ranch could generate an additional $2887 in revenues this upcoming fall (assuming the calves average 550 lb at weaning and the market price is $1.75/lb). A more conservative estimate would be to use the five-year average fall-run price for 550 lb steers which is around $1.41/lb; a 2% increase in conception rates would increase revenues over $2300.
Once production indicators are calculated for an operation, decisions need to be made on what can be done to improve them. Sometimes it may be the case that the cost to achieve a 1% increase in a production indicator outweighs the revenue gained, in which case, improvements are not feasible. But I do believe there is room for improvement somewhere on every ranch. Consider these proven management practices that are invaluable to maintaining and increasing the productivity of the cowherd:
- body condition scoring,
- feed testing,
- mineral programs,
- biosecurity,
- herd vaccination,
- bull soundness examinations, including testing for venereal diseases,
- neonatal disease prevention,
- low-stress weaning techniques,
- growth promotants such as implants, etc.
If you want to calculate production indicators for 2014, you will need to think back to how many cows and heifers were exposed for breeding in Summer 2013, how many females were confirmed pregnant during fall pregnancy check and how many bred females were on the ranch January 1st. Even go out and count today if you did not have opportunity to count at the start of the year. It’s never too late to start collecting the information required to evaluate the productive efficiency of your cow-calf herd.
Download the WBDC Cost of Production Calculation Tool
- Information: http://www.wbdc.sk.ca/economics_current.htm#copnow
- Download the Excel tool
- See a populated example for a made up ranch called ABC Ranch which shows how the data can be entered into the tool.

And for the tech savvy ranchers, there are apps and software available to assist with record keeping using smartphones and tablets. For example, the recently released iPhone app to keep calving records (iCalve) and herd record keeping software packages that interface with your smartphone (Cattlemax, BioTrack, LionEdge).
Being able to calculate production indicators for your ranch means you are collecting the bulk of the production records needed for cost of production analysis. To learn what other details are required, please feel free to contact me by email [email protected] or phone 306-930-9354.
Disclaimer: The app and software packages mentioned in this post are mentioned only as options currently available on the market. WBDC does not formally endorse any of these; it is up to each rancher to determine for themselves which is the best option for their operation. WBDC has been using Cattlemax on its research ranch since 2005.
Click here to subscribe to the BCRC Blog and receive email notifications when new content is posted.
The sharing or reprinting of this BCRC Blog article is welcome and encouraged. Please provide acknowledgement to the author and the Beef Cattle Research Council, list the website address, www.BeefResearch.ca, and let us know you chose to share the article by emailing us at [email protected].
We welcome your questions, comments and suggestions. Contact us directly or generate public discussion by posting your thoughts below.