Make Every Acre Count with the BCRC's New Gross Margins Calculator
Gross margin analysis can be used to evaluate the financial performance of various enterprises of a farm business within the short term. This analysis can assist in allocating limited resources (like land) to their existing enterprises to find which combination optimizes profit.
If a beef cattle producer has land allocated to specific uses (e.g., pasture, crops), the reallocation of this land has implications for the farm’s net income. For example, cow-calf producers must choose between maintaining pasture and hay land or converting it into cash crop production. These decisions are driven by ecological considerations (e.g., risk of erosion, too rocky), personal preference and the potential profitability of each land use.
An enterprise is defined by the commodity that is produced, the method of production or the activity performed.
Gross margin is the total revenue derived from an enterprise less the variable (direct) costs incurred in that enterprise (e.g., feed, fuel, seed). This can be reported for the whole enterprise or per unit of output. For example, land allocation can be considered on a per-acre basis to allow for comparison of gross margin between different land uses.
Boost profitability with the new BCRC tool for gross margin analysis
The BCRC’s new Gross Margins Calculator is an interactive decision tool to assist beef cattle producers when allocating limited resources (like land) to determine which combination of enterprises optimizes profit.
Gross Margin = Total Revenue − Variable Costs
Gross margin per acre shows the revenue remaining after variable costs, helping compare land uses to determine which generates higher returns per acre. This metric is useful for decision-making because it shows the relative profitability of an enterprise before accounting for overhead (fixed) costs. Overhead costs may include salaries, insurance and electricity.
The gross margin ratio reflects cost efficiency by indicating how much revenue remains after covering variable costs, offering insight into which enterprises cover the majority of overhead costs and the profitability of different enterprises. While a high gross margin ratio suggests good cost control, it doesn’t necessarily mean higher profitability in absolute terms.
For example, if two enterprises generate the same revenue, but one has lower variable costs, it will have a higher gross margin ratio. This suggests that for every dollar earned, more is left over after paying expenses like feed, seed or fertilizer.
A higher gross margin ratio means the enterprise is using its resources more effectively to generate profit, making it a good fit for determining land allocation.
Gross Margin Ratio = Gross Margin / Total Revenue
In a gross margin analysis, overhead costs are assumed to be part of the whole operation rather than allocated by enterprise. Unlike variable costs, which change with the unit of production, overhead costs remain constant with increased production. Overhead costs are not considered in the BCRC’s Gross Margin Calculator or in the following example.
Example 1: Land allocation and enterprise selection
Four enterprises were selected for analysis in this context:
- Cow-calf enterprise: Represents the core livestock operation, where revenue comes primarily from calf sales.
- Pasture enterprise: Reflects land used for grazing, with revenue modelled as fair market rent to separate land performance from livestock production.
- Hay enterprise: Involves forage production for internal use or external sales, offering a lower-risk option for feed security or revenue generation.
- Cash crop enterprise: Focuses on annual crop production for market sale, typically offering higher short-term returns but requiring greater input costs and planning.
This framework was chosen to reflect the multiple land use scenarios in mixed operations and provide producers with actionable insights. The analysis treats land and livestock as a unified system, reflecting the interdependence of extensive cow-calf management systems in Canada. This approach allows producers to evaluate the financial and risk implications of reallocating land to other uses, such as pasture, hay or cropland.
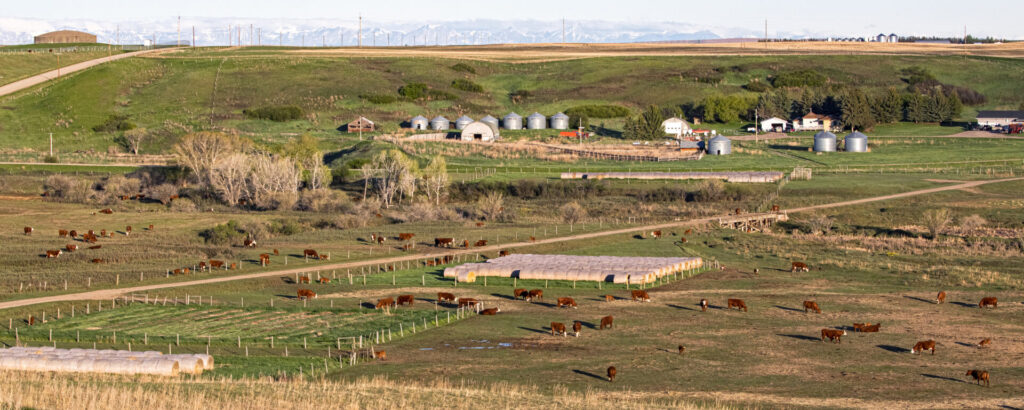
In the following scenario, the farm has 80 cows grazing on 500 acres, 500 acres of hay or forage for livestock (half is sold, and half is retained on-farm for winter feed) and 500 acres of annual cropland used for cash crops (Figure 1, Figure 2).
Figure 1. Direct costs and revenue for a cow-calf enterprise.
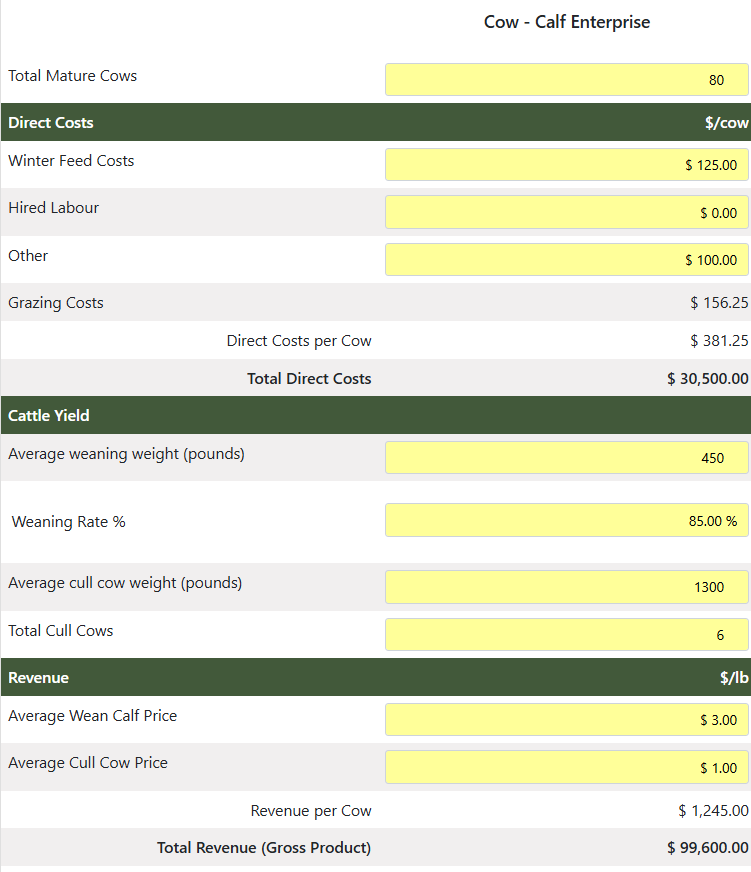
Figure 2. Direct costs and revenues from four potential land uses.
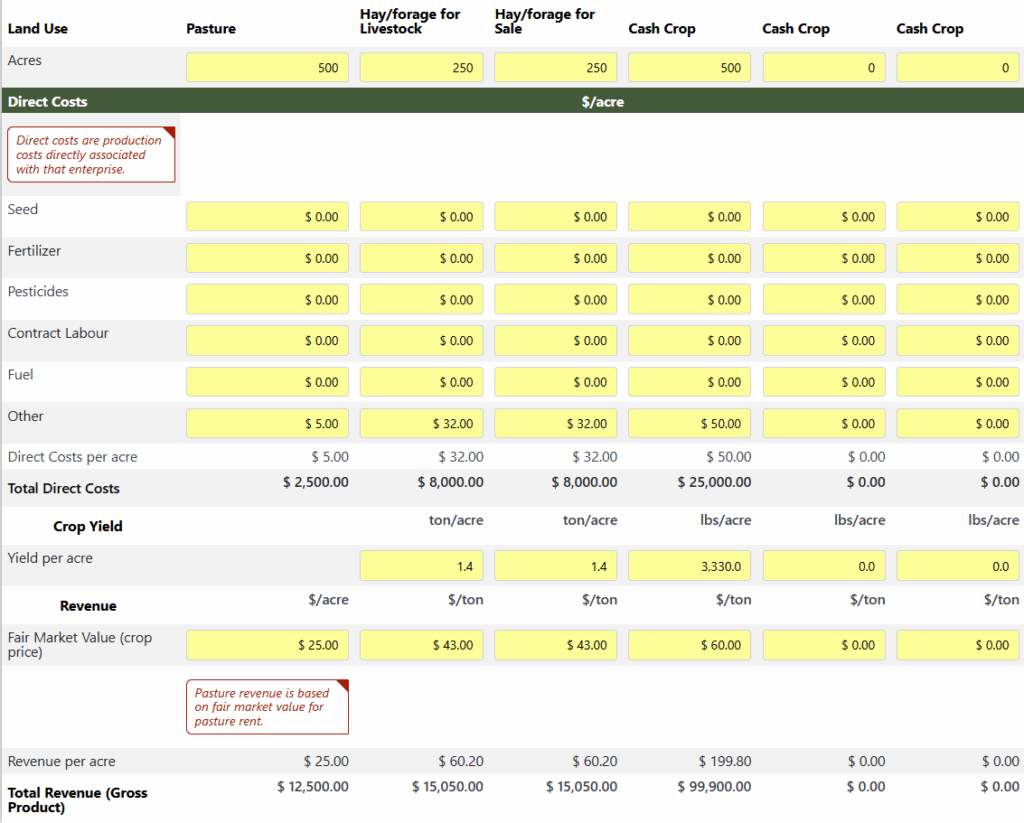
Information for the cow-calf enterprise is reported on a per-cow basis, while information for pasture, hay and cash crops are reported on a per-acre basis.
In an extensive cow-calf grazing system, the cow-calf and pasture enterprises can be combined to reflect the reliance of the cow-calf enterprise on available pastureland.
The highest gross margin per acre, or highest profitability, comes from the combined cow-calf and pasture enterprise ($158.20/ac) (Figure 3).
Figure 3. Gross margin per acre.
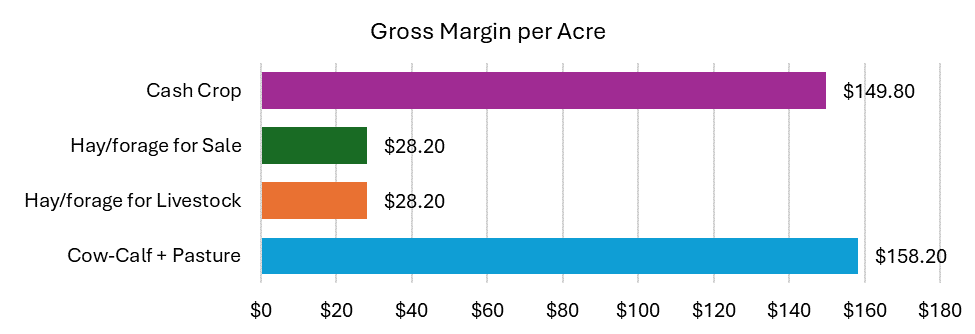
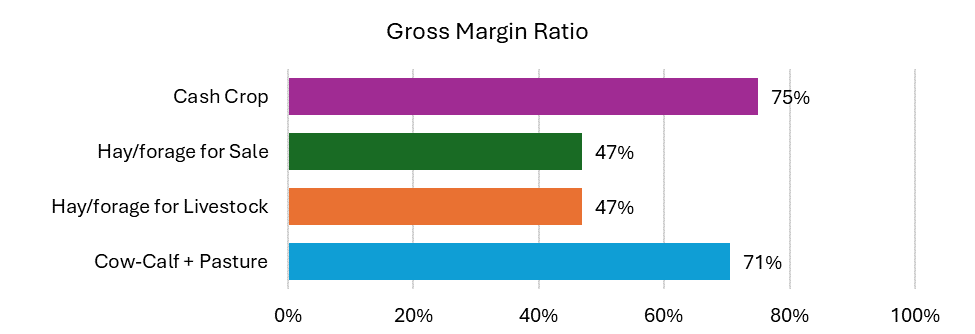
However, the highest gross margin ratio comes from the cash crop enterprise (75%), indicating it is the most cost-efficient in terms of variable costs, though total profitability depends on fixed costs and market conditions (Figure 4). The cash crop enterprise is effectively using its costs to generate revenue and will have more revenue available to contribute to the operation’s total overhead costs.
Figure 4. Gross margin ratio.
Example 2: Land reallocation
In Example 1, hay and forage production has the lowest gross margin per acre ($28.20/ac) and gross margin ratio (47%). A producer may decide to reallocate land designated for hay or forage for sale to either cash crops or to the cow-calf and pasture enterprise.
In option A, 250 acres of hay/forage land is converted to pasture, and the cattle herd is increased to 120 cows (Table 1). In option B, 250 acres of hay/forage land is converted into annual cropland. It is important to note that costs to implement changes–such as water systems, fencing and initial cultivation–are not included in the analysis below. Other than the number of cattle and acres of land, inputs are the same as in Example 1 (Figures 1 and 2).
Table 1. Option A: Comparison of reallocation of land used for hay/forage to cow-calf and pasture.
| Cow-Calf & Pasture | Pasture | Cash Crop | |
|---|---|---|---|
| Units of production | 120 head | 750 acres | 500 acres |
| Revenue: – Total – Per Unit | $145,500 $1,212.50 / cow | $18,750 $25.00 / acre | $99,900 $199.80 / acre |
| Direct Costs: – Total – Per Unit | $45,750 $381.25 / cow | $3,750 $5.00 / acre | $25,000 $50 / acre |
| Gross Margin | $114,750 $153.00 / acre | $114,750 $153.00 / acre | $74,900 $149.80 / acre |
| Gross Margin Ratio | 70% | 70% | 75% |
Table 2. Option B: Comparison of reallocation of land used for hay/forage to cash crop.
| Cow-Calf & Pasture | Pasture | Cash Crop | |
|---|---|---|---|
| Units of production | 80 head | 500 acres | 750 acres |
| Revenue: – Total – Per Unit | $99,600 $1,245.00 / cow | $12,500 $25.00 / acre | $149,850 $199.80 / acre |
| Direct Costs: – Total – Per Unit | $30,500 $381.25 / cow | $2,500 $5.00 / acre | $37,500 $50.00 / acre |
| Gross Margin | $79,100 $158.20 / acre | $79,100 $158.20 / acre | $112,350 $149.80 / acre |
| Gross Margin Ratio | 71% | 71% | 75% |
In both Option A and Option B, the cow-calf and pasture enterprise has a higher gross margin per acre, while the cash crop has the highest gross margin ratio. The cow-calf and pasture enterprise is more profitable on a per-acre basis. However, the cash crop enterprise is using its resources more effectively, generating more revenue for each dollar spent on direct costs.
While Option A benefits from a larger cow-calf operation having a higher total revenue, the higher costs lead to a smaller whole farm gross margin compared to Option B (Table 3). Whole farm gross margin is calculated by adding the gross margins of each enterprise (cow-calf + pasture + hay/forage for livestock + hay/forage for sale + cash crop).
Table 3. Whole farm from gross margin.
| Cow-Calf & Pasture | Hay/Forage for Livestock | Hay/Forage for Sale | Cash Crop | Total | |
|---|---|---|---|---|---|
| Ex. 1 | $79,100 | $7,050 | $7,050 | $74,90 | $168,100 |
| Ex. 2, Option A | $114,750 | $7,050 | $0 | $74,900 | $196,700 |
| Ex. 2, Option B | $79,100 | $7,050 | $0 | $112,350 | $198,500 |
Though Option B has the highest overall gross margin, Option A also has a higher whole farm gross margin than the original example. Changing land use from hay/forage for sale to either pasture or to cash crops increases the gross margin of the whole farm.
The Bottom Line
By examining the gross margin and gross margin ratio for all enterprises on a farm, beef cattle producers can make informed decisions on allocating limited resources, such as land, to enterprises that effectively utilize inputs to generate revenue.
Sharing or reprinting BCRC posts is welcome and encouraged. Please credit the Beef Cattle Research Council, provide the website address, www.BeefResearch.ca, and let us know you have chosen to share the article by emailing us at [email protected].
The BCRC is funded by a portion of the Canadian Beef Cattle Check-Off.
Your questions, comments and suggestions are welcome. Contact us directly or spark a public discussion by posting your thoughts below.