Constituer un troupeau performant : EPD, génomique et investissements génétiques intelligents ▶️
L’histoire suivante est fictive. Bien que le scénario soit réaliste, les personnages, les événements et les détails ne sont basés sur aucune exploitation ou personne en particulier.
Julia et Robert exploitent un élevage commercial vache-veau et accordent une grande importance à la prise de décisions éclairées et stratégiques en matière de gestion et de reproduction. Ils commercialisent tous les veaux au sevrage et ont pour objectif d’augmenter leur poids de sevrage de 20 livres sans compromettre la facilité de vêlage, ce qui reste une priorité essentielle tant pour la santé des vaches que pour les besoins en main-d’œuvre.
Cette année, ils envisagent d’acheter un ou deux nouveaux reproducteurs.
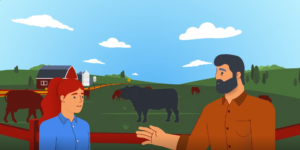
Un après-midi, assis à la table de la cuisine, une tasse de café à la main, ils feuilletaient les derniers catalogues de vente de taureaux remplis de photos sur papier glacé lorsqu’ils entendirent des pas sur le porche. C’était leur bon voisin et collègue éleveur commercial vache-veau, Andy.
« Vous magasinez des taureaux ? » demanda Andy en voyant les catalogues.
« On essaie, répondit Julia d’un air perplexe, en tapotant une page couverte d’images de taureaux entourées d’un cercle.
« Je peux jeter un œil ? demanda Andy.
Julia lui tendit le catalogue en disant « Bien sûr. Dis-moi ce que tu penses de notre sélection jusqu’à présent. »
Andy resta silencieux pendant un moment, feuilletant le catalogue. Quand il prit enfin la parole, il demanda : « Combien de temps passez-vous à analyser les EPD ? »
Robert haussa les épaules : « Nous regardons certains chiffres, mais pas tous. »
Julia acquiesça.
L’écart prévu dans la descendance (EPD) correspond à la différence entre la performance moyenne prévue des futurs veaux d’un animal et la performance moyenne des veaux d’un autre animal pour des caractéristiques spécifiques. Ces projections supposent que les taureaux ou les vaches élevés sont similaires et gérés dans des conditions similaires. Il s’agit essentiellement d’une projection de la valeur de cet animal en tant que parent.
La génétique derrière l’investissement
Andy désigna le tableau à côté d’une des photos de taureaux : « Considérez les EPD comme des prévisions de performance. Elles sont comme les résumés de votre portefeuille d’investissement. »
Robert ricana : « Les EPD sont désormais des investissements ? »
Andy répondit: « Absolument! Quand vous choisissez un taureau, vous investissez dans l’avenir à long terme de votre troupeau. Les EPD sont essentiellement la différence entre la performance moyenne prévue des futurs veaux du taureau et la performance moyenne des veaux d’un autre taureau pour des caractéristiques spécifiques. Ils vous indiquent ce que vous pouvez attendre de cet investissement: une facilité de vêlage améliorée, une croissance accrue, une carcasse plus lourde, une taille modérée des vaches adultes. »
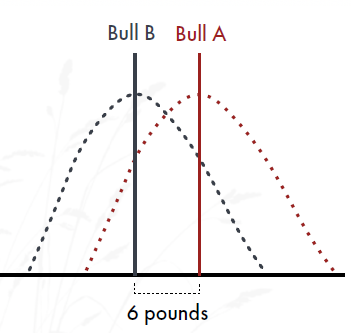
« Laissez-moi vous donner un exemple », poursuivit Andy en sortant un stylo et en dessinant deux courbes qui se chevauchaient au dos du catalogue. « Chaque courbe représente la fourchette de veaux que vous pourriez obtenir avec le taureau A par rapport au taureau B, et il y a beaucoup de chevauchements car tous les veaux ne sont pas identiques. Les lignes verticales correspondent aux EPD, c’est-à-dire la moyenne que vous pouvez attendre d’un groupe de veaux. Même si certains veaux ont un poids similaire, les veaux du taureau B devraient peser en moyenne environ six livres de plus au moment du sevrage. »
Robert hocha lentement la tête en se calant dans sa chaise.
« Ces chiffres ne sortent pas de nulle part », a ajouté Andy. « Il s’agit d’équations complexes basées sur les informations généalogiques et tous les résultats liés aux performances recueillis sur l’animal, ses proches et sa progéniture. Nous pouvons également ajouter des informations génomiques à cet ensemble. »
Julia haussa un sourcil. « Bon, j’ai souvent entendu ce mot. Mais que fait exactement la génomique ? »
« Cela renforce la précision des projections » expliqua Andy. « Lorsqu’un taureau a subi un test génomique, c’est comme si on effectuait un scan haute résolution de son « rapport de solvabilité génétique », ce qui permet de mieux comprendre les caractéristiques qu’il possède. Les projections deviennent plus précises, en particulier pour les taureaux plus jeunes qui n’ont pas encore beaucoup ou pas du tout de veaux. Elles peuvent également être utilisées pour caractériser des traits difficiles ou coûteux à mesurer, tels que les caractéristiques de la carcasse ou l’efficacité alimentaire. »
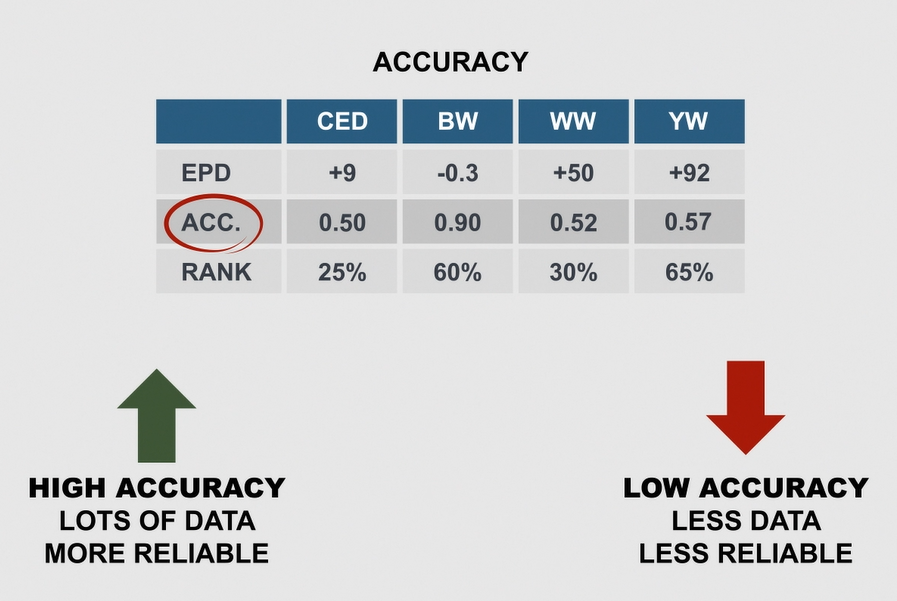
Il a pointé du doigt un taureau dans le catalogue : « Regardez le G ici, cela signifie que ce taureau a un écart prévu dans la descendance enrichi par la génomique (GE-EPD). Sa précision est également plus élevée grâce à cela, même s’il n’a que deux ans. Une précision élevée signifie que l’EPD est moins susceptible de changer à mesure que davantage de données sont disponibles, vous pouvez donc être plus sûr qu’il transmettra ces traits à ses veaux. »
La génomique est l’étude de la manière dont les gènes interagissent entre eux et avec leur environnement, et comment cela influence le phénotype d’un animal ou les traits observables qu’il exprime (p.ex., la couleur du pelage, la surface de faux-filet, le poids au sevrage).
La précision est notée de 0 à 1 (0-100 %) et indique dans quelle mesure une EPD est proche de la valeur génétique réelle d’un animal. Plus il y a de données disponibles, plus la précision est élevée.
Construire un portefeuille génétique de troupeau efficace
Robert feuilleta le catalogue, son attention désormais concentrée sur les données. « Notre objectif est d’obtenir des poids de sevrage plus élevés tout en contrôlant la facilité de vêlage », dit-il. « Comparons ces trois taureaux. Ils ont tous deux ans et sont de la même race. »
Il a encerclé les taureaux choisis et les a montrés à Andy.
« Quand on regarde les données, il est important de garder à l’esprit que les EPD sont des chiffres comparatifs. Il faut donc les comparer soit à la moyenne de la race, soit à un autre taureau », expliqua Andy en regardant les taureaux encerclés.
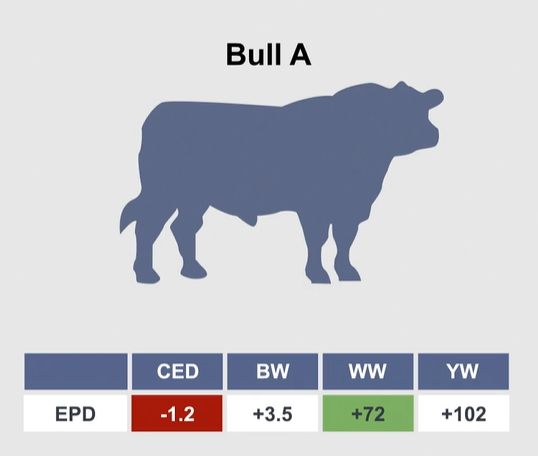
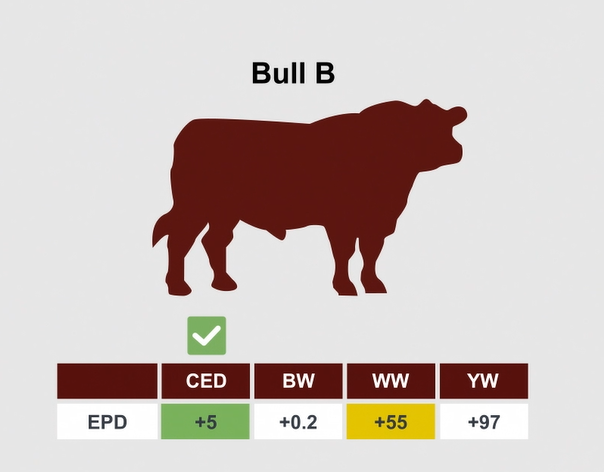
« Ce sont de beaux taureaux, mais regardons les chiffres », dit Andy. « Le taureau A a un EPD de +72 pour le poids au sevrage (WW), mais son faible CED (-5,2) en fait un choix risqué, car cela indique un risque plus élevé de difficultés lors du vêlage. »
Le taureau B offre une bonne facilité de vêlage (+5), mais un poids moyen au sevrage (+55) par rapport au taureau C. Le taureau C présente la même facilité de vêlage que le taureau B, mais ses veaux devraient peser 15 livres de plus au sevrage. Ce poids supplémentaire s’additionnera à l’ensemble du cheptel, faisant du taureau C le choix le plus équilibré et le plus rentable.
Les moyennes de race correspondent aux valeurs EPD moyennes de tous les animaux d’une même race pour un trait particulier. Elles constituent un repère permettant de savoir si un animal se situe au-dessus ou en dessous de la moyenne pour ce trait au sein de sa race.
Le poids au sevrage (WW) est mesuré en livres et indique la différence moyenne prévue en livres entre les poids au sevrage des veaux. Un chiffre élevé indique des veaux plus lourds au sevrage. Par exemple, un EPD WW de +70 signifie que les veaux de ce taureau devraient être, en moyenne, 15 livres plus lourds au sevrage que ceux d’un taureau ayant un EPD WW de +55.
La facilité de vêlage directe (CED) prédit la différence moyenne de facilité avec laquelle les veaux d’un taureau naîtront de génisses primipares. Un chiffre élevé indique un vêlage plus facile. Par exemple, un taureau avec un EPD CED de +10 par rapport à un taureau avec un EPD de +1 aurait 9 % plus de chances que ses veaux naissent sans assistance.
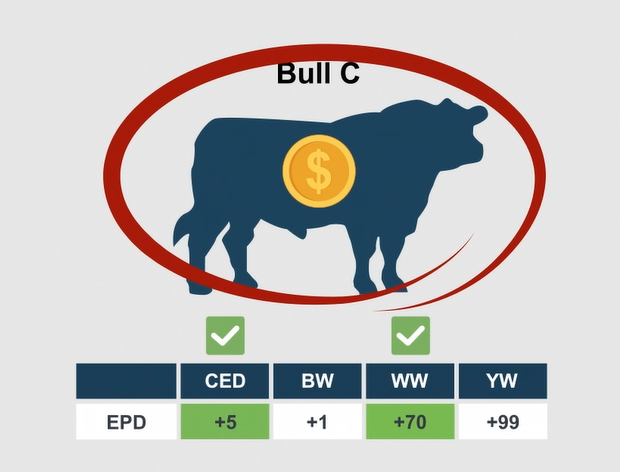
Julia semblait perplexe : « Mais le taureau C a un rang centile faible, à 30 %. Est-ce que cela fait une différence ? »
« Le rang centile peut être un peu déroutant », expliqua Andy. « Un chiffre plus bas est en fait meilleur, car cela signifie que le taureau surpasse la plupart de ses pairs au sein de la race. Un classement de 30 % pour le poids au sevrage le place dans les 30 % des meilleurs taureaux, ce qui signifie que ses veaux devraient, en moyenne, être plus performants que les veaux issus des 70 % restants. »
Le rang centile indique la position d’un animal par rapport à tous les animaux de la même race pour un trait donné, et est exprimé en pourcentage.
L’importance de la conformation
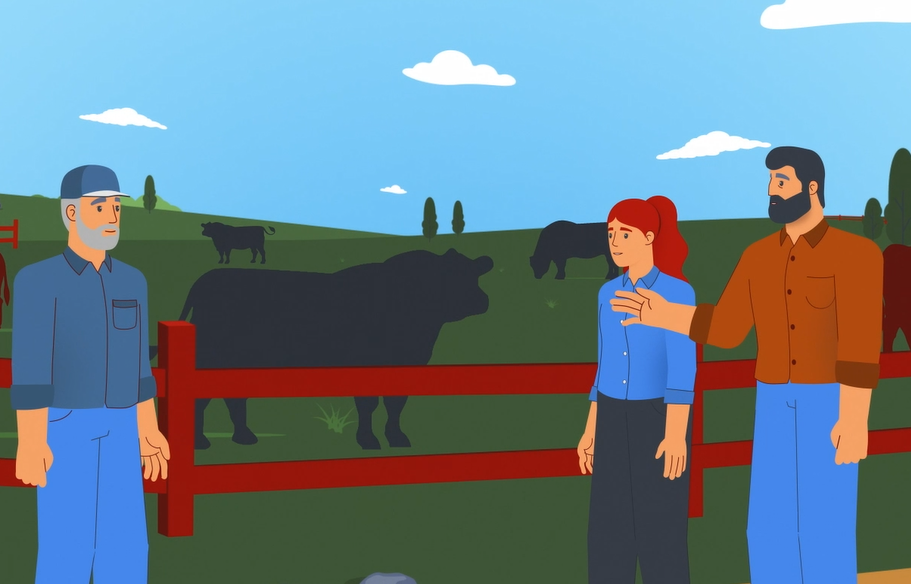
Avant que Julia et Robert ne ferment leurs catalogues, Andy leva le doigt. « Encore une chose », dit-il. « Les EPD et la génomique sont des outils puissants, mais ils ne remplacent pas vos yeux ni votre relation avec l’éleveur. »
Julia se pencha pour demander : « Que veux-tu dire ? »
« Il faut quand même évaluer le taureau lui-même », explique Andy. « Il faut examiner ses pattes et ses membres, sa structure et sa façon de se déplacer. Un taureau doit également passer avec succès une évaluation de la capacité reproductive du taureau (BBSE). La génétique permet de prédire les performances, mais un taureau dont la conformation est médiocre ne vivra pas assez longtemps pour offrir ces avantages. »
Robert acquiesça. « Donc, ce ne sont pas seulement des chiffres sur papier. »
« Exactement », répondit Andy. « Les meilleurs résultats sont obtenus en associant une génétique solide à une structure saine et à un programme de gestion en lequel vous avez confiance. »
Le choix judicieux d’un taureau qui a porté ses fruits
Après avoir rendu visite à l’éleveur, vérifié la conformation, le tempérament et le pedigree du taureau, Julia et Robert se sont rendus à la vente de taureaux et ont ramené chez eux le taureau C, sachant que les chiffres et la structure correspondaient à leurs objectifs.
Ce printemps-là, la différence a été immédiatement perceptible : les veaux sont nés facilement, avec moins de contrôles nocturnes, ils étaient vigoureux et ont rapidement commencé à téter. Au moment du marquage, la croissance supplémentaire était déjà évidente. À l’automne, les résultats étaient indéniables : leur poids moyen au sevrage avait augmenté de 15 livres, ce qui les rapprochait de leurs objectifs d’élevage.
Remerciements
Nous remercions les personnes suivantes d’avoir consacré leur temps et leur expertise à la révision de cet article et des ressources connexes.
- Karin Schmid, Beef Production and Extension Lead, Alberta Beef Producers
- Chelsey Siemens, Livestock and Forage Extension Specialist, Saskatchewan Ministry of Agriculture
- Macy Liebreich, Chief Executive Officer, Canadian Beef Breeds Council
- Stephanie Lam, Director of Research, Livestock Research Innovation Corporation
Le partage ou la réimpression des publications du BCRC sont les bienvenus et sont encouragés. Veuillez mentionner le Beef Cattle Research Council, fournir l’adresse du site Web, www.BeefResearch.ca/fr, et nous faire savoir que vous avez choisi de partager l’article en nous envoyant un courriel à [email protected].
Le BCRC est financé par une partie du prélèvement national sur les bovins de boucherie.
Vos questions, commentaires et suggestions sont les bienvenus. Contactez-nous directement ou lancez une discussion publique en publiant vos idées ci-dessous.