
This Level 2 record-keeping resource has been designed to build upon the record-keeping modules covered in Animal Health & Performance Record-Keeping – Level 1. The record-keeping and benchmarking modules are designed to be used by a wide range of producers and management systems. Each of the levels have been developed to target a level of experience where Level 1 is a good starting point for beginners, Level 2 is for someone that is more than a beginner but not quite advanced and Level 3 is designed to be the most advanced.
Animal health and performance records can be useful for making management decisions. Keeping track of your health treatments and performance indicators throughout the year can be useful information to have when evaluating your production goals. Having readily accessible records can also be handy when marketing cattle to prospective buyers.
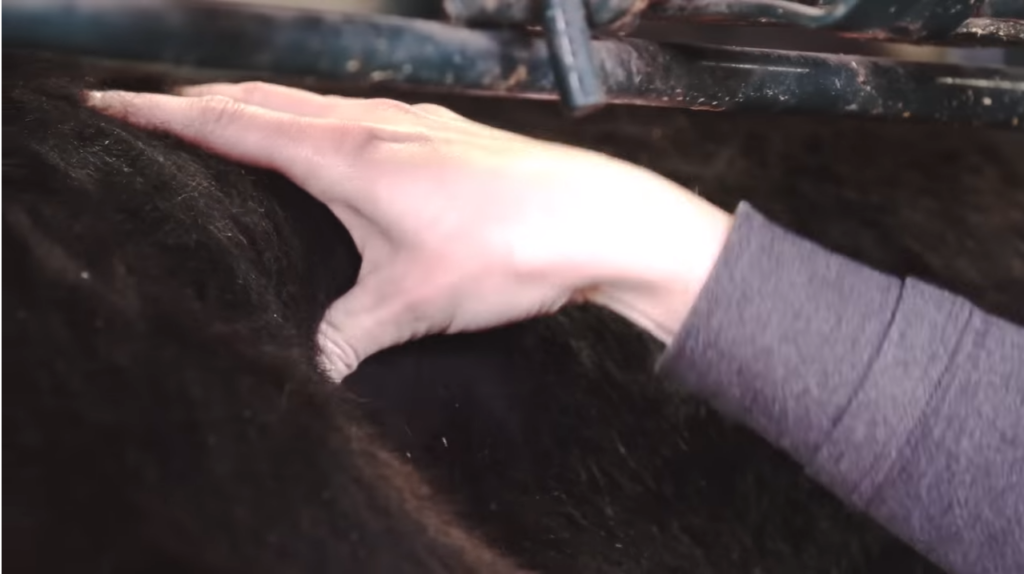
Body Condition Scores
Cows with an ideal body condition score (3.0 on a scale of 1-5) rebreed up to 30 days sooner than thin cows, which allows more cows to calve in the first 21-day cycle. This can add up to 42 lbs in calf weaning weight since the calves born earlier in the calving season will be heavier at weaning time. Cows in ideal body condition also have pregnancy rates double those of cows in poor condition, have improved milk production, passive immunity transfer, fewer cases of abortion and stillbirth, healthier calves, and fewer instances of calving problems.
| Industry Benchmark |
|---|
| BCS of 3.0 |
The salvage value of cull cows in good condition is also higher. Very thin cows are more likely to experience negative outcomes during transport or to be condemned at harvest. Thin cows reflect poorly on producers and the industry.
To learn how to do a hands on assessment of body condition scoring visit our BCS page.
Data to record:
- Body condition score (1-5) of each animal or sub-sampling from larger group.
When to record it:
One of the best times to body condition score is during fall processing or when pregnancy checking. This will give you time to add condition on thinner cows before winter sets in.
Example:
At fall processing in October, a sample of 30 cows from the larger group of 150 cows was evaluated for BCS. The average BCS for the 30 cows assessed was 2. The summer months had been particularly dry resulting in reduced forage availability and thinner cows. A decision was made to feed test the stored forages to ensure the cow herd would have adequate nutrition during the winter months to reach a BCS of 3 before breeding. Before releasing the cow herd back onto pasture for breeding BCS will be assessed again.
Trade-offs:
Increasing body condition scores will require additional investment for feed, but this may be offset by an improved reproductive rate for the following season.
Example goal:
- Improve body condition scores of the mature cow herd to 3 before the next breeding season.
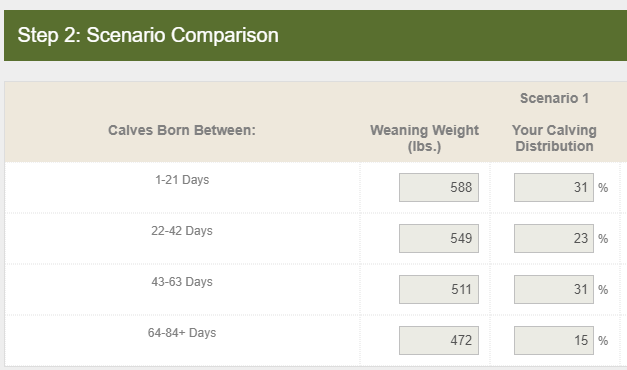
Calving Distribution
Establishing and maintaining breeding momentum is important. Once a cow is bred in the first part of the breeding season, she has a greater likelihood of breeding back early in the years to follow. Cows that are bred early will have calves that have greater potential to gain by weaning time, resulting in a uniform calf crop and improved profitability. For example, a calf born in the first cycle compared to one born twenty-one days later will have the potential to gain an extra 39 lb (i.e. 1.85 lb/day for 21 days) more than its later-born counterpart. This can result in additional revenue of $81 per calf if sale price is $2.08/lb.
| Industry Benchmark |
|---|
| 60% of calves born in the first 21 days of calving season. |

The standard industry target is to have at least 60% of females calving within the first cycle, followed by 25% calving between 21-42 days, 10% between 42-63 days and the remaining 5% calving in the fourth and final cycle. An ideal distribution could be 70-20-10 with a condensed breeding season of three cycles (63 days). The value of calving distribution calculator can help you determine your distribution using your own data.
Data to record:
- Bull turn out dates
- Breeding dates (AI, or observed natural breeding)
- Birth dates
When to record it:
- Record the bull turn out date(s) or breeding dates if using AI.
- Record calving dates at calving.
Example:
In Level 1 we used the example of a herd of 65 females, with the calving period starting with the first calf born on January 2, 2019. The very last calf was born on April 10, 2019. To determine the length of the calving period, count the number of days between January 2 and April 10. This equals a 99-day calving period.
Using the calving distribution calculator, it was determined that 31% of calves were born in the first cycle. There may be several factors impacting the distribution besides cow fertility. This can include body condition of the cow herd, cow to bull ratio, bull performance, weather, illness, or management factors such as when the bulls were pulled.
In order to reduce calving period length, you would first need to identify the factors contributing to the longer calving period before culling cows calving outside 84 days to ensure this is not just a cow fertility issue.
Trade offs:
Depending on your management system you may require two calving periods. A front-loaded calving period can require extra labour costs due to a greater workload to pick up bulls at the end of the breeding season.
Shortening the calving period can result in more open cows as later-calving females won’t have a chance to rebreed. This can result in short term losses from fewer calves sold at weaning.
Producers that utilize community pastures or even rent grass away from home may not be in control of when bulls are removed or have facilities to pick up bulls in 63 or 84 days.
Example goals:
- Reduce calving period length to less than 84 days within two years
- Reduce calving period to less than 63 days by year five
- Have 60% of calves born in the first 21 days by year five
Cow-to-Bull Ratio (Cow:Bull)
The capacity of the bull to perform during breeding is also limited by the fertility of the cowherd. Therefore, most efforts are placed upon ensuring that reproductive potential of the females in the herd is optimized. We often assume that the bull will do his job, if we make the correct management decisions regarding the cow herd.
| Industry Benchmark |
|---|
| 25 cows: 1 bull |
The economic implications of failure or reduced performance of bulls in a natural mating program can result in major losses. Even with the correct managerial and financial investments in place to ensure that the cow herd is reproductively competent, if reproductive failure occurs as a result of bull management, a tremendous loss in terms of reproductive efficiency is likely.
The more females that a bull can breed in a given season, the more optimal or efficient is the use of the capital invested in that sire. However, if you increase the cow:bull ratio, the likelihood increases that the bull’s mating capacity will be exceeded and fertility during the breeding season will be reduced. There is a point of diminishing returns, in terms of the reproductive efficiency of your herd and uniformity of the calf crop, if the mating capacity of the bull is exceeded.
The number of bulls required for effective reproductive efficiency will depend on the age of the bull, size of the pasture, topography, length of the breeding season and condition of the bull. A shorter breeding season will not only improve weaning weights but will also give the bull time to rest.
Data to record:
- Number of cows per bull
When to record it:
- Record at bull turn out date(s)
Example:
Using the same example from above, the 65 cows were kept on pasture with the same bull from June until October, a 65:1 ratio. To improve the calving distribution for the next year, the length of the breeding season was reduced, and an additional bull was purchased which changed the ratio to 33:1.
Trade offs:
- Underestimating the performance of your bulls resulting in an investment of additional bulls that were not needed.
- If multiple bulls are used in a pasture this can result in fighting versus breeding. The impact depends on age of bulls, number of watering holes and pasture topography.
Example goals:
- Purchase additional bull(s) to service more groups of cows effectively
Mature Cow Weight
Recording mature cow weights aims to “right size” cows for the productivity of the environment. Smaller cows do well in low productivity environments and can wean calves weighing 45% or more of their body weight. Very productive environments can support heavier cows that also wean 45% of their body weight. An apparent trend towards a smaller cow size is partly due to wanting the right size cow for the environment in semi-arid climates. But there are also advantages to larger cows in high productivity environments.
| Industry Benchmark |
|---|
| 45% of cow weight |
To determine the weaning weight as a percentage of cow weight simply divide the average weaning weight by the average cow weight and multiply by 100.
Average Pounds Weaned ÷ Average Mature Cow Weight X 100 = Weaning weight as percentage of cow weight
Data to record:
- Weights of cows
When to record it:
- During processing in the spring and fall
Example:
For 110 females exposed, their average weight was 1215 lbs:
593 lbs average weaning weight ÷ 1215 lbs average cow weight x 100 = 49%
Trade offs:
Selecting for larger mature weights may result in greater feed costs.
Example goals:
- Match a significant percentage of cow weight and forage intake to forage production prior to the next breeding season
Calculating Pounds Weaned Per Cow Exposed
Commercial cow-calf producers generate revenue based on total pounds of calf weaned and sold. There are only two ways to increase total pounds of calf weaned and that is by increasing the size of each calf weaned or by increasing the number of calves weaned. Pounds of calf weaned per cow exposed combines the herd reproductive rate, calf death loss, and genetics for growth and maternal traits into one number.
Pounds Weaned per Exposed Female = (Total Pounds Weaned) ÷ (Number of Exposed Females)
Data to record:
- Weaning weights
- Number of exposed females
When to record it:
- Record weaning weights at weaning
- Record number of females exposed prior to bull turnout
Example:
In Level 1 we calculated that the group of 105 calves had a total weaning weight of 65,205 lbs, an average of 621 lbs per calf weaned. If we were to include the number of females that were exposed at the beginning of the breeding season things may look a bit different. Assuming a herd of 110 cows:
65,205 lbs total pounds weaned ÷ 110 females exposed = 593 lbs per exposed female
If the number of exposed females was actually 120 females this would change to:
65,205 lbs average weaning weight ÷ 120 females exposed = 543 lbs per exposed female
Example goals:
- Improve reproductive efficiency by 2% within two years
- Reduce calf death loss between birth and weaning to 4% with four years
- References
-
FEEDBACK
Feedback and questions on the content of this page are welcome. Please e-mail us.
This content was last reviewed September 2025.