Make informed decisions for your operation with information delivered right to your inbox.
Get the latest tools, innovations and science-based information for the Canadian beef industry, including seasonal production considerations and economic analyses.
Animal Health & Performance Record-Keeping - Level 1
Are you new to animal health and performance record-keeping? Or, are you already keeping records but interested in leveling up?
This Level 1 record-keeping module is designed for producers who may be unsure of what information is worth keeping and how to best use these records. You will learn about the four animal production records to keep and compare to industry benchmarks that can help you make on-farm decisions.
It is important to note that these records do not have to be completed all in one sitting. Work at your own pace!
Would you like this information delivered as a six-part email course?
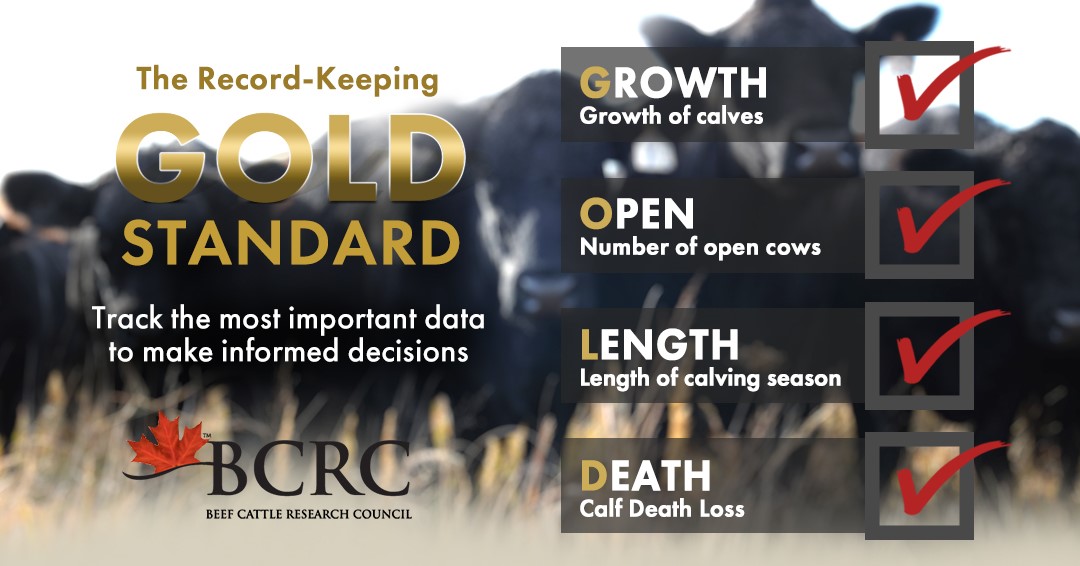
GOLD Management Indicators
There are four steps to animal health and performance records that are sometimes referred to as “GOLD Management Indicators.” The acronym GOLD stands for:
This module will explore each of these indicators as steps toward optimal animal health and performance record-keeping. A fifth step includes tracking health treatments and withdrawal times.
Whether you use a computer system or complete records by hand, each of these measures can be determined for your operation and compared to industry benchmarks for the same indicators. By comparing your numbers to benchmarks for the industry averages, you can assess areas where you may need to make improvements.
The following webinar presentation provides more information about GOLD Management Indicators.
Growth of Calves = Weaning Weights or Sale Weights
Growth is considered to be moderately heritable, influenced by both genetics and environmental factors including nutrition, health, dam performance and milking ability, and breeding decisions. Since many operations are only paid once per year after the sale of calves, improving weaning weights is one of the quickest ways to improve profitability by selling heavier calves.
Weaning weights can be recorded by using actual scale weights or by using sale weights if selling at weaning. Simply divide the total weight by the number of head to get an average number.
Over the last 20-30 years there have been gains in the cow/calf sector with weaning weights steadily increasing. A 5 lb increase in average weaning weights has been shown to decrease cost of production (COP) by $6.75/head1.
Total lbs weaned ÷ number of head weaned = average weaning weight (lbs)
Regional Benchmark
West: 570 lbs
Ont: 660 lbs
Atl: 527 lbs
Data to record:
The actual total number of weaned calves
Sale weights
Weights collected at weaning time
When to record it:
Collecting the number of weaned calves can take place at weaning when separating calves from dams.
The weight of the animals could be determined during processing or when the calves are sold.
If calves are not sold following weaning and are entered into a backgrounding system instead, gathering the weights after separating calves from dams may be the best option for this calculation.
Example:
The total weight for a group of 105 steers and heifers after the fall run is 65,205 lbs.
65,205 lbs weaned ÷ 105 steers and heifers = 621 lbs average weaning weight
Example Goals:
Weaning weights equal to 45% of cow weights by 2025
Increase average weaning weights by 5 lbs by 2023
Trade-offs:
Selecting cattle to produce greater weaning weights has been shown to impact cow size. This may result in larger framed females and higher feed costs in your cow herd.
Open Rate (%)
Fertility is the greatest factor in herd productivity and is also a main driver of profitability. Cows that calve and re-breed every 12 months have the greatest impact on herd productivity. Infertility, or cows that don’t re-breed, can be caused by several reasons such as nutrition, disease, heat stress, mineral imbalance, or inferior genetics.
Feeding a cow during the winter accounts for 50% of the total cost to keep her in the herd. Pregnancy checking for open cows can help you make decisions that will save winter feed costs.
To determine the percentage of females in calf, divide the total number of females in calf by the total number of females and multiply by 100 to get a percentage. With this percentage, you can then compare your performance to other producers in your area or in Canada.
Reproductive efficiency takes into account, among other factors, the number of calves born per the number of cows exposed. A 2% increase in reproductive efficiency decreases COP by $16.50/head1.
Number of open females ÷ total number of females x 100% = Open rate
Industry Benchmark
Less than 7% open
Data to record:
Total number of females
Number of open females
When to record it:
Record the total number of females in the breeding herd and the total number of open females at preg-checking.
Example:
A herd has a total of 65 females. After vet palpation, it was determined that 55 were safely in calf and 10 were open.
10 open females ÷ 65 total females exposed x 100% = 15% open females
For many operations, an ideal but unrealistic situation would be to have all 65 females in calf. The benchmark suggests that less than 7% of open females is a good target. A decision can then be made about what to do with the ten open females.
Example Goals:
Less than 7% open females in 2021
Sell open cows to reduce feed costs
Trade-offs:
The open rate of a herd can vary depending on the management requirements of an operation. For example, a higher open rate may be acceptable for some operations due to labour costs or other factors such as the market price of cull cows.
To help producers choose the most economical option for their operation, the BCRC’s Economics of Pregnancy Testing Beef Cattle Model calculates the gain or loss per head when preg-checking and culling open cows in the fall compared to overwintering and culling in the spring.
Length of Calving Period
The length of the calving period is another good measure of fertility within your herd. The ability to have more calves born in a shorter time period can produce a more uniform calf crop and can improve average weaning weight, as calves born earlier in the calving season will be heavier. It is also important to provide enough time for females to recover and begin cycling before rebreeding.
To measure the length of the calving period, count the number of days between the first and last calf. The target in an ideal situation is 63 days or three typical estrus cycles (21 days each).
Last calf date – first calf date = length of calving period
Industry Benchmark
63 days in length
There could be many reasons why a calving period may be longer such as inability to remove the bull while on summer pasture, lack of facilities to pick up the bull, other farming activities. Calving periods, like open rates, may vary according to management needs.
Among other things, a shorter calving period can improve uniformity and weaning weights because calves will be closer in age and will have a similar amount of time for weight gain compared to a calf crop where the calves are born over a longer period of time.
Data to record:
Dates of the first and last calf born on your operation
When to record it:
Record the dates when the first calf is born and when the last calf is born
At spring processing (aka branding) this will still be memorable
Example:
For the herd of 65 females mentioned above, the calving period started with the first calf born on January 2, 2019. The very last calf was born on April 10, 2019. To determine the length of the calving period, count the number of days between January 2 and April 10, this equals 99 days total length.
There are online calculators available that will perform this calculation for you. The number of days can also be determined using formulas in spreadsheet software.
Calf Death Loss
Keeping track of calf losses can help you to identify where you might be having a herd health issue. For example, calves that die in the first 24 hours may be related to a management decision or other factors such as genetics, calves not getting enough colostrum, dystocia, weather, and predation. While calves that die between one day old and weaning may also be caused by illness, predation, weather or calving hygiene, identifying where any death loss is occurring will help producers recognize management considerations to get more live calves.
Death losses from calving to weaning in the cow/calf sector vary widely not only from operation to operation but also from year to year as they are impacted by herd health, weather, and predators. There are advantages to a smaller operation that can give more attention to a smaller herd if it reduces death losses. A 1% increase in death loss increases COP by $7.45/head1.
Total calf deaths ÷ number of females that calved x 100% = calf death loss
Industry Benchmark
Less than 4% loss
Data to record:
Total number of calves lost from birth to weaning
Total number of females that calved or were expected to calve
When to record it:
Record the number of calves lost as they happen until the last expected calf is born.
The total number of females could be recorded at preg-checking.
Example:
From a group of 55 females, there were five dead calves recorded.
5 calf deaths ÷ 55 females that calved x 100% = 9% calf death loss
The industry benchmark for death loss per year is less than 4%. This suggests that there may be an issue to correct before the next calving season which may be addressed by working with your veterinarian, nutritionist and livestock specialist to create an action plan.
Example Goals:
Calf death loss of 4% or less in 2020
Identify management changes that will produce more live calves
Trade-offs:
Let’s say an operation has a calf death loss of 7%. To reduce the number of early calf death losses on this operation, it is determined that it will require additional producer or staff time and labour to observe cows that are calving. The trade-off having higher staff costs or more time for the producer to monitor cattle more frequently may not outweigh the potential savings of more live calves.
Health Treatments and Withdrawal Times
Animal health records can be useful for making management decisions. Having readily accessible health records are also handy when marketing cattle to prospective buyers. They can also assist with culling decisions, for example, is this the second time or the third time you’ve treated this cow for lameness, and when is she safe to market?
Keeping track of your health treatments throughout the year can be useful information to have when evaluating your production goals. Recording information such as whole herd health protocols, calf birth and calf processing vaccination and treatment protocols could be used to clarify the impact these protocols are having on your performance measures. For example, it may be possible to relate a higher calf death loss to the health treatments typically given (or not given) at birth.
Cow-calf producers and feedlot managers have an important role to play in food safety. On-farm practices help to avoid certain food safety concerns such as chemical residues or broken needles at processing facilities to ensure the safety and confidence of consumers. It is through good on-farm food safety practices that Canada maintains an excellent reputation for food safety which increases consumer confidence both domestically and internationally. This is also a critical component when participating in export market opportunities.
Some suggested information to keep in your animal health treatment records include:
ID (Animal or Group): Whether you treated an individual or a large group, keep track of which animals were treated.
Treatment date(s): Recording the date of each treatment can be used to determine withdrawal times.
Treatment: The name of the product used.
Volume and route: The exact dosage delivered and by which route (intramuscular-IM, subcutaneous-SC).
Withdrawal date: The date the animal would be safe to ship according to the product label.
Table 1: Example of calculating withdrawal times
ID (Animal or group)
Treatment Date(s)
Treatment
Volume and route
Withdrawal date
Cow with set of twins
Jan 15, 2019
Metacam
Sub-Q, 544 Kg gave 13.6 mL (2.5 mL per 100 kg)
Feb 4, 2019
Individual Treatment
During calving, a producer gives a shot of Metacam to a cow that had a difficult calving with the set of twins on January 15. The vet indicates that the withdrawal date for slaughter is 20 days. The twins died after calving and the producer decides to ship the cow. The earliest the cow can be shipped is February 4.
Group Treatment
During the fall run, a producer treats a group of steer calves post weaning. The herd health plan from his veterinarian lists pour-on ivermectin and a modified live virus vaccine. To determine the withdrawal time for this group you would need to identify the treatment with the longest withdrawal time. In this case the ivermectin withdrawal time is 49 days. The withdrawal time for the group would be 49 days from the treatment date.