This Level 2 record-keeping module has been designed to build upon the resources covered in Forage & Grasslands Record-Keeping-Level 1. The record-keeping and benchmarking modules are designed to be used by a wide range of producers and management systems. Each of the levels has been developed to target a level of experience where Level 1 is a good starting point for beginners, Level 2 is for someone that is more than a beginner but not quite advanced and level 3 is designed to be the most advanced level.
Winter Feed and Stored Forages
Cow body condition in late fall or early winter has a major impact on the total amount and quality of feed required. Cows in thin condition in the fall must gain weight throughout the winter to be able to deliver a live healthy calf, provide adequate amounts of milk, become pregnant and produce a calf the following year.
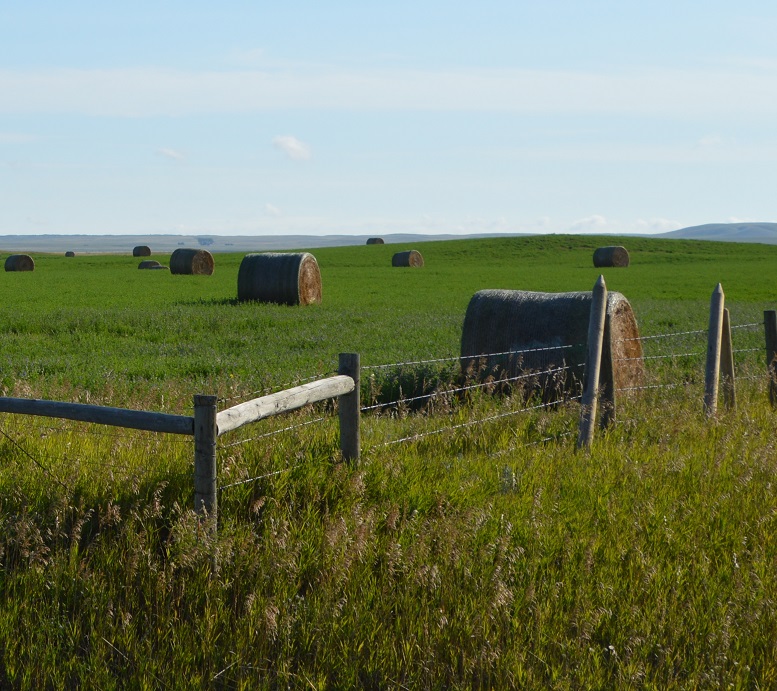
Across Canada many beef cows are fed a significant amount of conserved forage during winter. While extending the grazing season with stockpiled grass and annual forage crops can reduce the length of the feeding season on many operations, there is still a lot of baling and chopping done in preparation for the colder months. Harvesting, storing and delivering the herd’s winter rations are the largest variable cost of production. Even small improvements in the system can result in significant savings.
Across Canada many beef cows are fed a significant amount of conserved forage during winter. While extending the grazing season with stockpiled grass and annual forage crops can reduce the length of the feeding season on many operations, there is still a lot of baling and chopping done in preparation for the colder months. Harvesting, storing and delivering the herd’s winter rations are the largest variable cost of production. Even small improvements in the system can result in significant savings.
Benchmarks
Comparing benchmarks for forage production is a challenge due to the variability from location to location. Comparing production numbers within your own operation is one way to manage your year to year production and to determine whether your management decisions are having the desired effect on production. Having a baseline of your typical production can also aid when making decisions during atypical years. For example, how you can manage in a drought year versus a bumper crop year.
Crop Records
When managing forages, just like other crops, the implementation of good record-keeping is valuable for managing plant productivity, crop rotations and soil fertility.
Complete and accurate records help demonstrate your protection of soil, water and other environmental resources and will help you analyze the performance of your farm’s forage production system.
Table 1: Example Crop Record
| Field ID/ Location | Acreage/ Hectares |
Number of bales/loads | Weight of bales/loads | Inputs | Weight of bales/loads |
|---|---|---|---|---|---|
| Old Farm | 100 acres | 150 | 1470 lbs | Manure, 3 loads, October 2018 | 1 tonne/acre |
| Old Farm | 100 acres | 150 | 1544 lbs | None | 1.01 tonne/acre |
Field Identification
Keeping an accurate description of the location of each field will assist with keeping precise production records.
Data to record:
- Legal land location
- Identification recognized by land managers/staff,
- Size in acres or hectares
When to record it:
- At time of purchase
- After dividing a field
Field Inputs
Research has indicated that fertilization can bring the productivity of a stand back to its original level without the expense of re-seeding. However, even when fertilizer is applied at recommended rates, the target yields may not be achieved, making it a risky proposition. The goal of fertilizing is to decrease the per unit cost of production. Higher yields do not necessarily translate into lower costs or increased profits. Only when the value of the additional production surpasses the cost of application does it reduce the per unit cost of production and increase margins. The profitability of fertilizing forage crops is highly variable and depends on timely rains, the cost of the fertilizer and hay prices. As these factors change, so will the feasibility of fertilizing.
If an assessment of the current forage stand shows that there is a sufficient quantity of the desired plant species still present, then fertilization can be an effective tool to rejuvenate and increase forage yields. By applying nutrients that are limiting, as determined by taking a soil test, forage production can be improved.
A soil test is essential to determine which nutrients are currently available and which may be deficient. Without this critical information there is a good chance that your investment may be money misspent. Knowing what nutrients to apply and in what quantity is an important first step in a fertility program.
Data to record:
- Treatment
- Date
- Volume
- Location
When to record it:
- Following application
Yields
Examining profit margins per field can be easily calculated when hay yield and price per ton are recorded. Producers need to know yields and market prices in order to estimate potential profitability – or calculate actual net returns after the hay is marketed or for own use. A greater awareness of your yields could direct you to making changes that will bring about greater productivity and profitability from a given field.
Data to record:
- Weight of bales
- Number and weight of cart loads
When to record it:
- At harvest
Yield calculation:
A 100-acre field produced 150, 5’x5’ round bales that each weighed 1470 lbs (667 kg). Dry matter was not yet tested.
Yield = (150 bales x 1470 lbs/bale)/ (100 acres x 2205 lbs) = 1 tonne per acre
Example crop production goals:
- Improve forage yield at the Old Farm by 5% within one year, pending adequate weather conditions
Feed Inventory
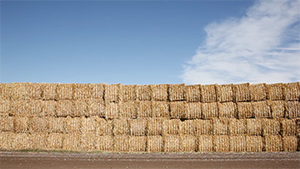
After all of the effort and expense of producing the forage, ensuring that it is being efficiently utilized by the animals is the critical last step. Developing a feed inventory is the first step to help track feed utilization and thus improve feed management.
Efficient feed utilization includes:
- Matching the quality of the forages to the right animal group
- Monitoring feed disappearance
- Minimizing feed wastage
- Comparing the amount of feed offered to what the cows should be consuming
Some things to consider:
- Current feed inventory for all types of storage units/feed types (bunkers, agbags, baleage, dry hay, bins). Calculate silage capacity in bunkers and silos here.
- Determine your feed needs by determining the number of animals and their stage of production (lactating cows, heifers, backgrounders, bulls)
- Determine potential growth. Do you plan to buy or sell any large groups?
- How much are you feeding per head per day?
- How long does this feed need to last?
- Determine the balance. Do you have enough? Can some forage be sold?
Data to record:
- Current inventory
- number of animals and their stage of production
- volume fed per day
- feed test results
When to record it:
- February/March – allows you to make a mid-course correction prior to the next harvest season. Estimates of density will be more accurate after having fed from storage for a while, so estimates of quantity stored will be more accurate.
- June/July – allows you an early warning of inadequacy of feed supplies for the up-coming feeding season. Purchases of standing crops remain an option if deficiencies are discovered.
- October/November – in a drought year, when production has been unexpectedly low you may want to make a projection to see if purchased feed will be needed or if the consumption rate needs to be adjusted. This allows needed purchases when commodity prices are apt to be lower in winter and will allow purchases before December 31, assisting in tax management.
Example goals:
- Create a feed inventory after each year’s harvest and update as it is fed out
Feed Waste
The following section was adapted from Beef Cow Winter Feed Utilization page from the Ontario Ministry of Agriculture, Food and Rural Affairs.
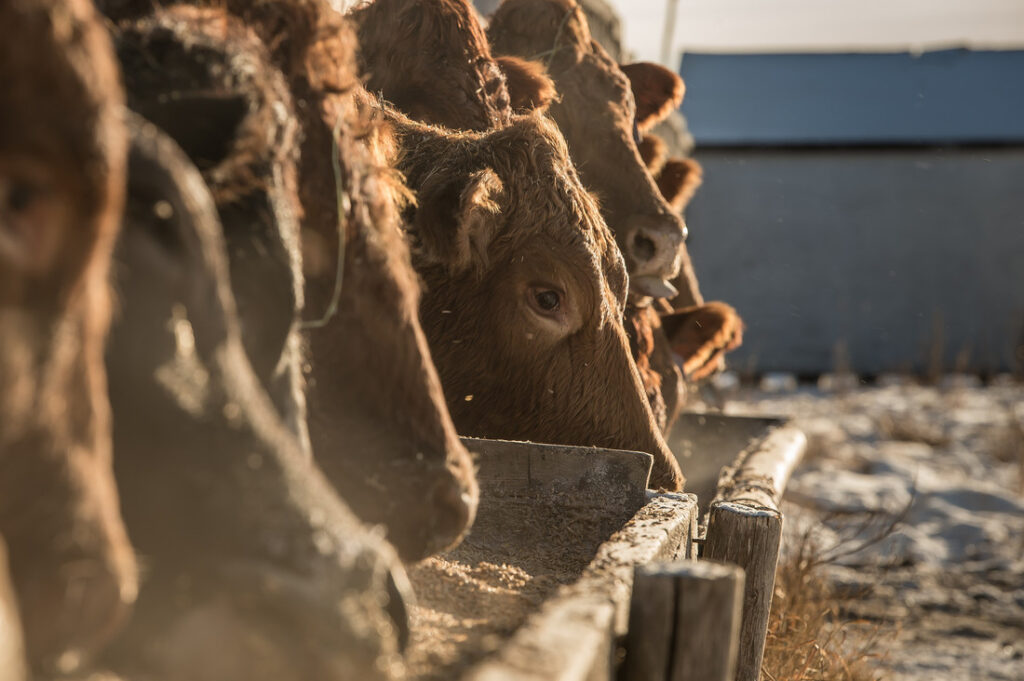
When producers talk about the amount they are feeding their cows, they are usually referring to the amount of forage offered and which disappears from the inventory. This will always be larger than what the cows are actually consuming. The difference is due to several factors, including:
- the wastage of forage as it is being moved from storage
- feed tramped into the ground or bedding,
- feed soiled by manure or urine,
- feed which is left uneaten until the next lot of feed is delivered,
- inedible crusts on bales which may be removed prior to feeding.
It’s important to have a good idea of how feed disappearance matches up with the expected intake of the cows. If the gap is too wide, after adjusting for typical wastage, there may be some issues with the feeding system that can be corrected in order to save feed and therefore money. If actual feed intake is significantly lower than anticipated, after accounting for wastage, there may be an issue with the quality of the forage. Table 2 has some guidelines for evaluating various levels of feed disappearance.
Table 2: Interpretation of the Difference between Observed Forage Disappearance and Predicted Intake1
| % Difference2 | Interpretation |
|---|---|
| < 6% | Excellent utilization of forage |
| 6% to 10% | Very Good utilization; some slight improvements may be possible |
| 11% to 15% | Good utilization; some improvements possible |
| 16% to 20% | Medium utilization; significant improvements possible |
| 21% to 25% | Poor utilization; very significant improvements possible |
| >25% | Very Poor utilization; critically evaluate feeding system |
2 (Observed disappearance – Predicted intake) / Predicted intake X 100
Here’s an example of a feeding scenario:
- 50 cow management group
- Cows average 1500 lbs, in good body condition, dry, mid third of pregnancy
- Average daily temperature is -5 C°, feeding area is sheltered from the prevailing wind
- Ground conditions are dry
- Being offered 4′ X 4′ dry hay bales which weigh 600 lbs
- Hay was tested and is 84% DM with 54% TDN (DM basis)
Step 1: What is the expected dry matter feed intake of these cows?
| Basic cow dry matter intake calculation: | Cow dry matter intake adjusted for environment: |
|---|---|
| DMI = Cow wt. X % DMI (per lb of cow wt.) DMI = 1500 lbs X 2.2% Dry matter intake = 33 lbs per cow |
DMI = 33 lbs X 1.05 (air temp) X 1.00 (mud) |
After adjustments, the expected dry matter intake per cow is 34.7 lbs.
Step 2: What is the expected actual (as fed, AF) amount of hay which would be consumed by these cows? We need to convert our estimated dry matter intake to an AF basis for the hay being offered.
| As Fed Intake calculation |
|---|
| As Fed Intake = DMI lbs / % DM in the hay AF Intake = 34.7 lbs / 84% DM AF Intake = 41.3 lbs |
So, we would expect each cow to consume about 41.3 lbs of hay per day. For the feeding group of 50 cows this would be:
| To feed 50 cows: |
|---|
| 41.3 lbs X 50 hd = 2065 lbs of hay |
Step 3: Converting this to bales of hay
2065 lbs / 600 lbs = 3.44 bales of hay per day
Step 4: The group is being fed an average of 3.5 bales per day, with a very minimal amount left in the feeders. How does this feed disappearance match up with what is expected? Let’s look at it on a per head basis:
Feed disappearance/hd = 4.0 bales X 600 lbs per bale / 50 hd = 48 lbs/hd/day
Step 5: We had estimated the hay disappearance for this group in Step 2 as 41.3 lbs/hd/d. The difference between feed disappearance and estimated intake:
Difference = disappearance – estimated intake
= 48 lbs – 41.3 lbs
= 6.7 lbs
Step 6: On a percentage basis this would be:
Difference / estimated intake X 100%
6.7 lbs / 41.3 lbs X 100% = 16%
This indicates that about 16% of the feed which is being offered is not actually being eaten by the cows, there is likely significant room for improvement. It would be a good idea to closely observe the cows’ feeding behavior and see how much hay is being pulled out of the feeder and lost on the ground, as well as how much forage is being left uneaten in the feeders. In trials, hay wastage when feeding round bales has been measured from 5% to 40%, with the higher range occurring when the bales are rolled out on the ground.
Data to record:
- Expected dry matter intake
- Feed disappearance
When to record it:
- Daily, at feeding
Example goal:
- Reduce feed waste to the 11 to 15% range using methods that reduce trampling in the next 365 days.
Feed Testing
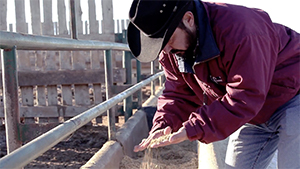
When you don’t know the quality of feed on an operation, maintaining animal health and welfare can become significantly more difficult. Visual assessment of feedstuffs is not accurate enough to access quality and may lead to cows being underfed and losing body condition or wasting money on expensive supplements that aren’t necessary.
Why should I feed test?
- Avoid subtle production problems, such as poor gains or reduced conception caused by mineral or nutrient deficiencies or excesses;
- Prevent or identify potentially devastating problems due to toxicity from mycotoxins, nitrates, sulfates, or other minerals or nutrients;
- Develop appropriate rations that meet the nutritional needs of their beef cattle;
- Identify nutritional gaps that may require supplementation;
- Economize feeding, and possibly make use of opportunities to include diverse ingredients;
- Accurately price feed for buying or selling.
One of the major benefits of feed testing is preventing costly and devastating problems before they start. Every season is different and some years there is an abundance of high-quality forage. Other years, there is a lack of available feed, or perhaps there is an abundance of low-quality forage, grain, or grain by-products available that may look economical but can potentially pose significant risks if a feed analysis has not been performed or understood. Feed testing should be completed as close as possible to when it will be fed for the most accurate results.
Learn more about the how and why of feed testing and interpreting results.
Data to record:
- Date
- Type of feed sampled
- Volume of sample
- Location of sample
- Analysis results
When to record it:
- Following sampling
Example:
A sample of grass silage was taken from the silage produced from the 100-acre field at the farm mentioned above. The results of the feed test were entered into the Evaluating Feed Test Results Tool on Beefresearch.ca and received the following result:
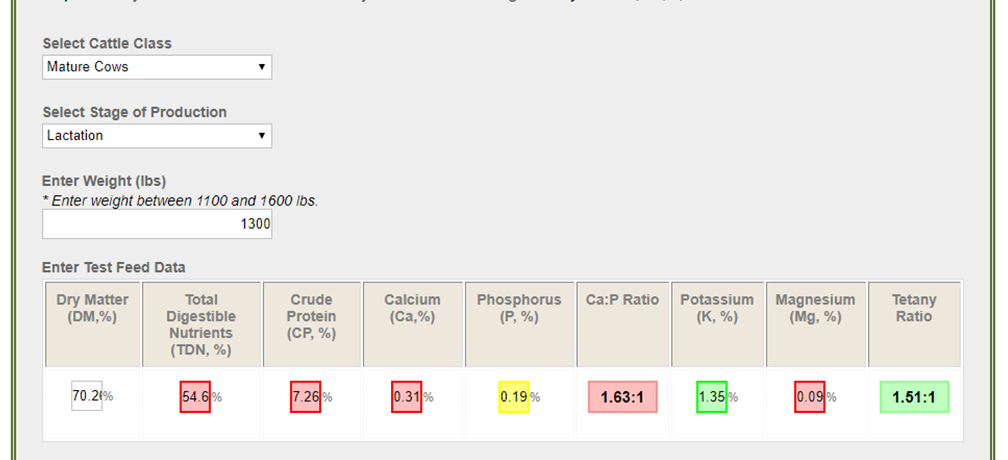
The results suggest that the feed will not be adequate to feed on its own to lactating mature cows and should be fed with additional feedstuffs such as additional energy, vitamins, minerals and a protein source. The next step will be to work with a nutritionist or ration balancing software program to determine a balanced ration for the lactating cows.
Example goals:
- Work with a nutritionist to mitigate any potential nutritional deficiencies
- Establish a location to keep all feed test results and use to monitor progress year to year
Winter Feed Ration
While hay, pasture, other forages and grains make up the largest component of livestock feed, there are many alternative feeds that can be provided and even improve the diet. Cost effective procurement of non-conventional feeds can increase profitability across the operation.
Alternative feeds can include crop residues, damaged crops, processing by-products, fruit, vegetable and bakery waste, off grade grains and even weeds. Resourceful producers will consider several factors when sourcing alternative feeds:
- cost of feed
- cost of transportation
- storage of feed including special bins, silos, or conditions to reduce spoilage
- nutritive value of feed including any deficiencies or toxicities that must be corrected
- consistency and ongoing availability of feed
- ease of integration into operation, such as special feeding management, grinding, or mixing equipment required
- palatability of feed and acceptance by livestock
The inclusion of alternative feeds in a ration or feeding program can reduce feed costs and stretch feed supplies, while meeting nutritional requirements. Weather events such as drought, flooding, late spring frosts or hail can impact conventional feed supplies and increase prices. Many producers incorporate non-conventional feed sources into their rations to reduce costs and reliance upon hay or silage. While non-conventional feeds can be a cost-effective choice, producers will need to compare the actual costs of each feed source, along with transportation and storage to determine viability. A calculator for evaluating the relative economic value of feeds based on protein and energy content is available to assist producers when making these decisions.
Cattle require appropriate levels of energy, protein, fibre, vitamins and minerals to allow maintenance, growth, reproduction and gestation, milk production, and to support the immune system. When sourcing and adding non-conventional feeds to the ration, consult a livestock nutritionist to obtain the best advice for ration balancing. Conduct feed tests for each feed source. Balance nutrient requirements for the sex, age, body condition and stage of production of the cattle being fed. For example, straw can be a low-cost alternative feed, however, it requires supplementation with additional energy, protein and minerals to provide adequate nutrition for all classes of cattle.
Visit the alternative feeds webpage for more information about using alternative feeds and the risks and benefits of different types of feed sources.
Data to record:
- Type of feed
- Feed test results
- Purchase cost
When to record it:
- Following purchase
- After feed testing
Example:
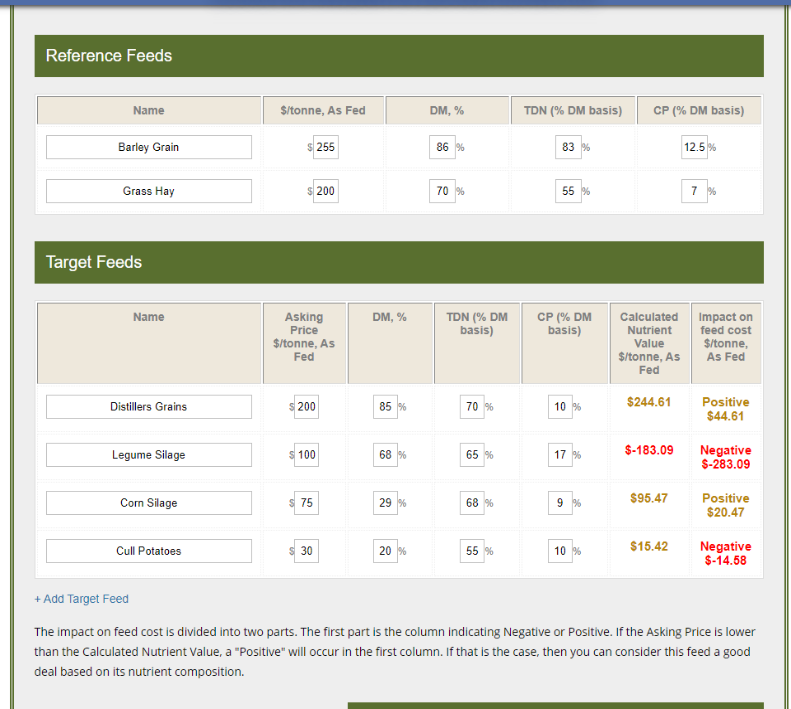
Since the feed test on the grass silage was not optimal and the price of barely is higher than you would like, you decide to look into some options for alternate feeds to feed the group of lactating, mature cows. Using the Tool for Evaluating the Economic Value of Feeds Based on Nutrient Content you enter some options for feeds you are considering purchasing. The results (shown below) indicate that distillers’ grain and corn silage may be good options to supplement the herd, where the legume silage and cull potatoes may not be good options economically.
- References
-
National Beef Cattle Evaluation Consortium Sire Selection Manual
This content was last reviewed January 2020.