Improving your vision for the 2020 production year: New tools for on-farm record keeping in cow-calf operations

Are you curious about which areas of your operation are excelling? Or which areas of your operation that might need some work?
Are you interested in record keeping but not sure where to start?
Successful farm management begins with accurate and up to date records. The process of record keeping allows the farm manager to collect and save data so it can be analyzed and used to make better decisions and turn information into actions.
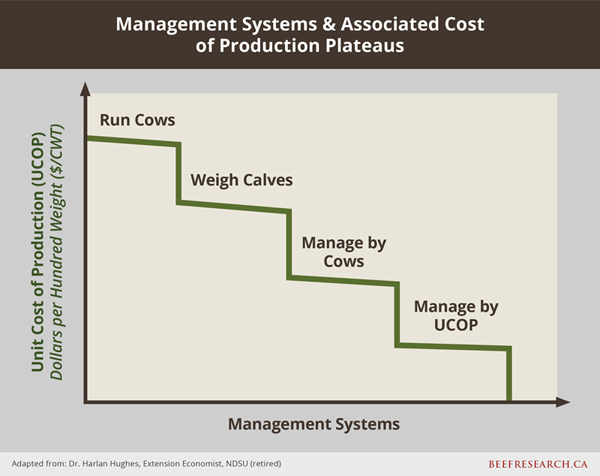
It is important for producers to identify what information is needed to support you in making management decisions. While collecting, maintaining, and analyzing records requires an investment in time, the ability to make decisions based on a known history of your particular farm is valuable. Dr. Harlan Hughes’ analysis of North Dakota cow/calf operations showed that those actively using their own farm data tended to have lower unit costs of production per pound of calf weaned. The operations that were using their own data were also the most profitable over time. The more information producers gather on their operations, the more efficient the knowledge and management of your herd becomes.
A series of modules and a new indicator tool have developed to be used by a wide range of farm managers to assist with better on-farm record keeping and benchmarking. Some operations may not fit perfectly into one level for all the topics. For example, your financial record keeping may already be at the intermediate or advanced level, but you may feel that you are more of a beginner in the forage and grassland area or vice-versa. Your current record keeping practices may be a combination of levels depending on the topic, which is normal and to be expected! Please note that currently only level 1 is available to view. The resources for Levels 2 and 3 will be published over the next few months.
Cow-Calf Production Indicator Tool
Why monitor cow herd productivity? Productivity is a key driver of per unit cost of production and monitoring on farm productivity from year to year allows for issues to be identified as they may creep up overtime.
Why benchmark? Benchmarks follow standardized definitions, calculations and interpretation allowing comparisons to be made and herd management strengths and weaknesses to be more easily identified and managed.
Reproductive Efficiency
Cow-calf profitability is strongly tied to reproductive efficiency. The goal is to have as many cows wean a live calf as efficiently as possible under your production system and environment. Starting with the number of females exposed to the bull, there are multiple places where cows may be “falling out” of the system (i.e. failing to conceive and wean a marketable calf each year). This could occur during the breeding season with lower conception rates, through abortions or dystocia with a lower calving rate or throughout the summer grazing season with a higher calf death loss between birth and weaning resulting in a lower weaning rate.
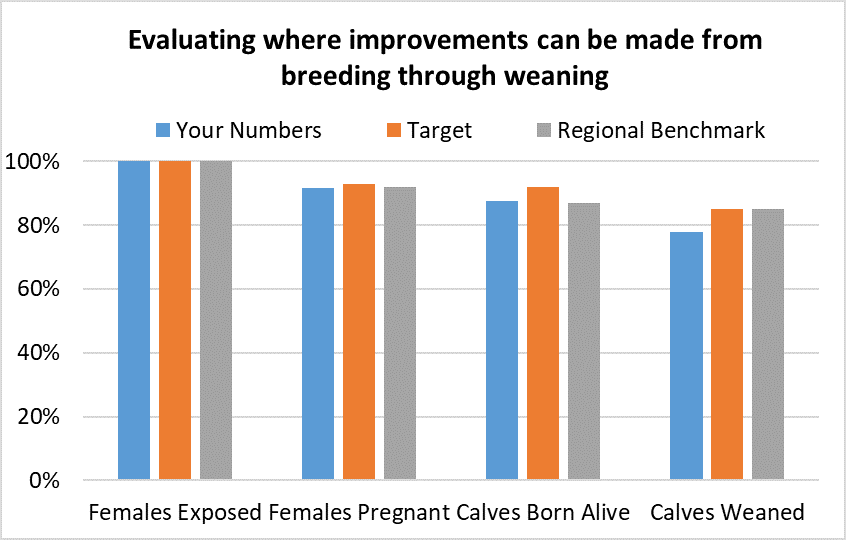
The question is where should an operation focus their effort? The below chart is taken from the Cow-Calf Production Indicators Calculator, which allows producers to enter their own numbers (only 15 numbers are needed) and compare them with an Industry Target and Regional Benchmark from the most recent regional cow-calf surveys. It evaluates where improvements can be made from breeding through weaning. Where does performance deviate? Is it during the breeding season with bull power, during the calving season or with pre-weaning calf health?
Conception Rates (aka Pregnancy percentage = Females Bred / Females exposed)
Conception rate calculates the percentage of females pregnant after exposure to a bull. It is an indication of the cowherds’ fertility.
This is the inverse of open rates, the O in the GOLD indicators. There are multiple factors that impact conception rates from cow nutrition and body condition score to the length of the calving season, cow:bull ratio and bull fertility.
Length of Calving Period (Last Calving dates – First calving date)
The goal is to have a cow calve every 365 days. In order to achieve that with a 285-day gestation it is recommended to keep the calving season to no more than 80 days. A longer breeding season/calving period does not ensure a cow will have a calf every year. In addition, reducing the breeding season length contributes to a more uniform calf crop and higher weaning weights. This does require labour, time, and basic facilities to remove and hold bulls at the end of the breeding season. However, reducing the breeding season can also negatively impact conception rates, at least initially, until selection pressure for improved fertility and the benefits of improved nutritional management permeates the herd.
Cow:Bull Ratio (Females exposed / Bulls used)
Low fertility or inadequate bull power could decrease the conception rate. Cow-to-bull ratios vary significantly by farm size (large or small), farm type (crop and livestock or livestock only), and production type (extensive or intensive) (Alemu et al. 2016). Rough terrain and younger bulls typically justify a lower cow-to-bull ratio. For smaller herds, they may need at least one bull for any number of cattle up to 25. In larger herds with multiple sires, producers may run a lower cow-to-bull ratio to reduce the risk of cows not being bred due to bull injury or low libido. However, more bulls in a multi-sire pasture may also increase the risk of injury due to fighting, especially if bulls are similar in age.
Calving Rate (Live calves born / females bred)
Calving rate is the number of live calves born per 100 females bred. It doesn’t matter if the calf was born alive or dead, provided it was full-term. Aborted calves, however, are not considered full-term and are not included in the number of calves born. This performance measure provides an indication of a cow herd’s management during gestation.
Inversely you can look at pregnancy loss. Many producers do not know their exact calving rate. Or it is their only indicator of conception rate and therefore the herd’s fertility. However, if there are an abnormally high number of abortions it can indicate this is an area to be looked at.
Weaning Rate (aka Calf Crop or Weaning Percentage = Calves weaned / Females exposed)Weaning rate represents the number of calves weaned per 100 females exposed. The denominator “per 100 females exposed” is consistent with the Conception Rate and Calving Rate – allowing the above chart to be made which provides a consistent comparison to females exposed and each step reducing in number.
Alternatively, you can calculate the calf survival rate which is the number of calves weaned per 100 calves born alive. This is the inverse of calf death loss. Calf mortality is typically measured in two periods: (1) first 24 hours after birth and (2) from Day 1 to weaning. While calf mortality levels fluctuate by region and year, the reported level of calf loss has the potential to greatly reduce profitability and is influenced by herd health protocols, exposure to diseases and weather. In order to reduce calf loss, one must understand the cause of death.
Average weaning weight (all calves)
The average weaning weight for all calves is the Growth in the GOLD indicators. Per unit cost of production is directly related to the number of pounds produced. If producers are focused on increasing weaning weight, they may want to examine their calving distribution or management on pasture (e.g. creep feeding).
Calving Distribution
Each time a cow is not bred during a 21-day heat cycle, it can cost up to 39 lbs of weaning weight (assuming an average daily gain on calves of 1.85 lbs/day). The Calving Distribution calculator allows producers to see what their current calving distribution is, and the impact on revenue if they move to the industry target of 60-25-10-5 (e.g. 60% of cows calving in first 21 days of calving season, 25% calving from day 22 to 41, 10% calving between day 42 and 62 and 5% open), or a condensed breeding season of three cycles.
Adjusted 205 day weaning weight
Some production systems are not focused on maximizing weaning weight. If your production system typically weans earlier, at say 180-190 days of age, comparing to regional benchmarks will be inaccurate. Instead, adjust both the regional benchmark and your own data to a standard 205 day weaning weight to allow for accurate comparisons. This removes the bias from different production systems. This is done for you in the Cow-Calf Production Indicator Calculator.
Weight per day of age (lbs)
Another way of removing the bias from different production systems is to compare the weight per day of age rather than the weaning weight. This removes the impact of having an older or younger calf at weaning resulting in skewed comparisons.
Overarching Indicators
A couple of overarching indicators that provide a quick snapshot of herd performance are the number of pounds weaned per female exposed and the average weaning weight as a percent of mature cow weight.
Pounds weaned per female exposed
Commercial cow-calf producers generate revenue based on total pounds of calf weaned and sold. Simplistically, there are only two ways to increase total pounds of calf weaned: 1) increase average weight of each calf weaned or 2) increase the number of calves weaned. It combines the herd reproductive efficiency, calf death loss, and genetics for growth and maternal traits. This recognizes that a heavier weaning weight can be offset by a lower weaning rate and vice-versa.
Average weaning weight as a percent of mature cow weight
Research has shown that cow efficiency is dependent on the level of nutrition they receive. Larger, higher-producing cows are the most efficient in lush, high nutrition environments and smaller low-producing cows are the most efficient in limited nutrition environments. Measuring beef cow efficiency includes determining the amount and quality of feed consumed compared to the net return.
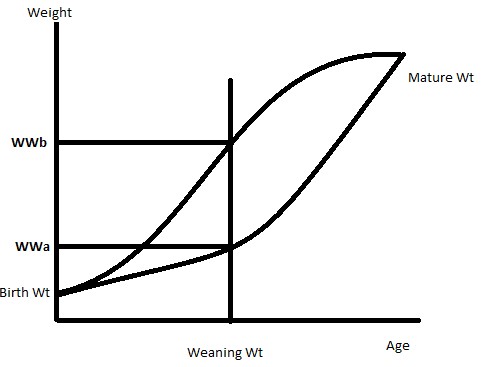
Cow efficiency can be gained through a lower feed conversion ratio and therefore lower energy requirements for the cow, or higher productivity through heavier wean weight, lower death loss, or higher reproductive efficiency. The idea is to have a low birth weight, same mature weight but a heavier weaning weight, resulting in a bent growth curve with faster maturing cattle.
A long-standing goal is to produce a calf that is at least 45% of the mother’s body weight. This can be achieved with a cow of any size. Assuming a cow will eat around 2% of body weight per day, a 1300 lb cow will eat 26 lbs/day and a 1500 lb cow will eat 30 lbs/day. If feed costs are $120/tonne, annual feed costs would be $517 and $596 respectively. If the calf of both cows is 45% of the mature body weight the breakeven on feed costs for both calves will be the same at $0.89/lb. But if the calves are only 38% of the mature cow weight the breakeven on feed is $1.03-1.05/lb. While the ideal cow size will vary with the environment, the goal of a bent growth curve is attainable with any cow size.
Conclusion
Routine monitoring of standardized performance measures can provide valuable information over time, particularly when coupled with comprehensive records of managerial change and performance impact from those changes. When producers understand how each of the values is calculated, records can be more effectively evaluated to determine the potential impact of decisions on cow herd performance.
Learn More:
- AgriProfit$ https://www.alberta.ca/agriprofits.aspx
- Standardized Calculation and Interpretation of Basic Cow Herd Performance Measures http://extensionpublications.unl.edu/assets/html/g2094/build/g2094.htm